6. ESG Momentum in International equity returns and the SDG content of financial asset portfolios
Authors:
Phoebe Koundouri, School of Economics and ReSEES Research Laboratory, Athens University of Economics and Business; Department of Technology, Management and Economics, Denmark Technical University (DTU); Sustainable Development Unit, Athena RC; Academia Europea; phoundouri@aueb.gr
Conrad Felix Michel Landis, ReSEES Research Laboratory and Msc Banking and Finance, Athens University of Economics and Business; Visiting Faculty, India Institute of Management Rohtak; conrad@aueb.gr
6.1 ESG Momentum
During the last decade, there has been a growing interest in financial investors, asset owners and academics in investigating the impact of Good/ Bad performance relative to the Environmental, Social and Governance criteria (ESG) to the company’s financial performance, as expressed by the Cost of Capital (Bauer and Hann,2010; Schneider, 2011), Stock Valuation (Jiao,2010) and stock returns (Gerhard et al, 2015; Kahn et. a, 2016; Henriksson et al, 2018).
Although there are many studies which relate good company ESG performance with higher equity returns, WHELAN et al (2021) in an extent meta-analysis of the literature report that only:
“26% of studies that focused on disclosure alone found a positive correlation with financial performance compared to 53% for performance based ESG measures (e.g., assessing a firm’s performance on issues such as greenhouse gas emission reductions). This result holds in a regression analysis that controls for several factors simultaneously”.
Our study contributes to the literature along three important directions. First, we document, strong ESG momentum time series and cross-sectional effects in international stock returns during the years 2002 to 2023. An out of sample monthly rebalancing ESG momentum Factor mimicking portfolio (double sorted on market capitalization and ESG momentum) yields an annualized Sharpe ratio equal to 0.7 for the sample period. Moreover, we underline the importance that both ESG related performance, as well as ESG controversies are important determinants of financial performance. Last by not least, by transposing the ESG framework into a more holistic framework integrating the SDGs, we describe how our models can be used to trivially calculate the SDG footprint of financial portfolios, which is expected to be very relevant the years following the introduction of the CSRD.
This chapter is structured as follows. In Section 6.2 , we describe the data and methodologies used in our study. Section 6.3 presents the main empirical results and the implementation of the international ESG and SDG asset pricing factors. Section 6.4 summarizes and provide concluding remarks.
6.2 Data and Methodology
Our ESG sample consists of 11.328 equities listed in international stock exchanges and covers a period of 21,5 years from 31 December 2001 to 31 May 2023[1]. The Regional breakdown is provided in Table 2.
Table 2 Number of Companies by Geographical Region
| Region | # Companies |
|---|---|
| North America | 4.060 |
| Latin America | 389 |
| Europe | 2.579 |
| Asia Pacific | 4.107 |
| Africa | 193 |
| Total | 11.328 |
We use Thomson Reuters EIKON Datastream (TDS) to extract daily data for total return indexes[2], market capitalization and a set of static/ descriptive datatypes, as well as a set of ESG related metrics offered by Thomson Reuters Refinitive (TRF). Table 3 provides a short description of all datatypes included in our study. Daily return and market capitalization data are filtered, following the methodologies proposed by Landis and Skouras (2021). Daily returns are aggregated to monthly and expressed at US dollars ($). To avoid any impact of outliers, monthly returns are cross sectionally winsorized to [1,99].
Table 3 Thomson Reuters Datastream datatypes referenced in paper.
We collect and report short definitions for all TDS datatypes referenced anywhere in the paper, summarizing the detailed definitions offered on Datastream Navigator. Detailed Worldscope data definitions guide is available on Thompson Extranet. Following TDS datatype classification panels devide TDS datatypes between time series and descriptive-static.
| TDS Datatypes | ||
| Datatype | Name | Definition |
| MV | Market Value | Share price multiplied by the number of ordinary shares in issue. |
| RI | Total Return Index | This describes the growth in value of an investment of 100 local currency units on the base date, assuming that dividends are re-invested to purchase additional units of an equity or unit trust at the closing price applicable on the ex-dividend date. Ex-date detailed dividend data are available from 1988, except USA and Canada where they are available from 1973. |
| EXMNEM | Exchange Mnemonic | Exchange Mnemonic. TDS mnemonics are based on the ISO codes. |
| GEOGN | Geographical Classification of Company | Country of incorporation. |
| TR3 | TRBC (The Refinitiv Business Classification) Industry Group Code | TR3 returns the Industry Group code from The Refinitiv Business Classification system. Covering over 250,000 securities in 130 countries to 5 levels of granularity, The Refinitiv Business Classifications (TRBC) is the most comprehensive, detailed, and up-to-date sector and industry classification available. Dedicated, local language speaking analysts utilize company filings, Reuters news, and our corporate actions services in order to assign and maintain a company's activity. The basis for our sector indices, TRBC helps you identify, monitor, and analyze companies and industries across global markets. It is the ideal tool for benchmarking, peer comparison and navigation, and building custom sector and thematic indices. TRBC consists of five levels of hierarchical structure. Each company is allocated an Activity which falls under an Industry, then an Industry group, then Business Sector, which is then part of an overall Economic Sector. For more details on the TRBC classification system click here: https://my.refinitiv.com/content/mytr/en/product/thomson-reuters-business-classification.html |
| TR3N | TRBC (The Refinitiv Business Classification) Industry Group Name | TR3N returns the Industry Group name from The Refinitiv Business Classification system. |
| TRESGS | ESG Score | Refinitiv's ESG Score is an overall company score based on the self-reported information in the environmental, social and corporate governance pillars. |
| TRESGCCS | ESG Controversies Score | ESG controversies category score measures a company's exposure to environmental, social and governance controversies and negative events reflected in global media. |
| ENSCORE | Environment Pillar Score | Refinitiv's Environment Pillar Score is the weighted average relative rating of a company based on the reported environmental information and the resulting three environmental category scores. |
| CGSCORE | Governance Pillar Score | Refinitiv's Governance Pillar Score is the weighted average relative rating of a company based on the reported governance information and the resulting three governance category scores. |
| SOSCORE | Social Pillar Score | Refinitiv's Social Pillar Score is the weighted average relative rating of a company based on the reported social information and the resulting four social category scores. |
| TRESGENRRS | Resource Use Score | Resource use category score reflects a company's performance and capacity to reduce the use of materials, energy or water, and to find more eco-efficient solutions by improving supply chain management. |
| TRESGENERS | Emissions Score | Emission category score measures a company's commitment and effectiveness towards reducing environmental emission in the production and operational processes. |
| TRESGENPIS | Environmental Innovation Score | Environmental innovation category score reflects a company's capacity to reduce the environmental costs and burdens for its customers, and thereby creating new market opportunities through new environmental technologies and processes or eco-designed products. |
| TRESGSOWOS | Workforce Score | Workforce category score measures a company's effectiveness towards job satisfaction, healthy and safe workplace, maintaining diversity and equal opportunities, and development opportunities for its workforce. |
| TRESGSOHRS | Human Rights Score | Human rights category score measures a company's effectiveness towards respecting the fundamental human rights conventions. |
| TRESGSOCOS | Community Score | Community category score measures the company's commitment towards being a good citizen, protecting public health and respecting business ethics. |
| TRESGSOPRS | Product Responsibility Score | Product responsibility category score reflects a company's capacity to produce quality goods and services integrating the customer's health and safety, integrity and data privacy. |
| TRESGCGBDS | Management Score | Management category score measures a company's commitment and effectiveness towards following best practice corporate governance principles. |
| TRESGCGSRS | Shareholders Score | Shareholders category score measures a company's effectiveness towards equal treatment of shareholders and the use of anti-takeover devices. |
| TRESGCGVSS | CSR Strategy Score | CSR strategy category score reflects a company's practices to communicate that it integrates the economic (financial), social and environmental dimensions into its day-to-day decision-making processes. |
To measure ESG performance we use the TRF metrics and scores. TRF offers one of the most comprehensive ESG databases, covering over the 90% of the global market capitalization, offering more than 600 ESG related metrics, with a history dating back 2002. TRF’s ESG scores, cover 10 categories including under the environmental pillar: emissions, environmental product innovation and resource use, under the social pillar: community, human rights, product responsibility and workforce; and under governance pillar: csr strategy, management, and shareholders. The categories scores account for the most material industry metrics (70 to 170 metrics are used for each sector based on a set of 25 themes). The scores are calculated using a percentile rank scoring methodology and are based on the relative performance of stocks with the company’s sector (for environmental and social pillar scores), and the country of incorporation (for governance related scores). Moreover, materiality weights are used to aggregate category scores to the three pillars, as well as the overall company’s ESG score[3]. Moreover, the performance metrics are supplemented with a data-driven controversy score, which is based on 23 ESG controversy topics, where companies’ actions are verified against commitments, to magnify the impact of significant controversies on the overall ESG scoring. Controversies are benchmarked on industry group and a company with no controversies will get a score equal to 100.
Kahn et. AL (2016), note that the identification of material items and the use of scores based on industry material items can lead to outperformance of the Good ESG companies relative to Bad. On the same direction ESG scores using material items are also positively correlated with the stock’s performance during the year following portfolio construction (Henriksson et al, 2018). Consistent with the previous research, we use the scores provided by TRF, which incorporate, as explained earlier, an industry materiality assessment. Moreover, the non-mandatory nature of the corporate sustainability reporting, together with the absence of any third-party auditing reports, constitutes, as discussed later in the chapter, the identification of Controversies to most accurately identify companies that do perform good relative to their industry and country peers.
TRF metrics have found its application to recent academic studies (Park, 2018; Vasilescu and Wisniewski, 2019; Dorfleitner et al, 2020), where all studies underline a thin relationship between ESG performance and stock returns, while the heterogeneity of results is strengthened even further with the use of various stock selection criteria.
Table 4 reports the number of stocks per country and per industry in our sample. To be consistent with the calculations of the TRF scores, we use the The Refinitiv Business Classification Codes (TR3 datatype in Table 3) to map stocks to industries.
Table 4 Number of Stocks Per Country, per Industry
| Market | #Stocks | Share (%) | Industry | #Stocks | Share (%) | |
|---|---|---|---|---|---|---|
| UNITED STATES | 3431 | 30.29 | Banking Services | 865 | 7.64 | |
| CHINA | 1104 | 9.75 | Software & IT Services | 722 | 6.37 | |
| INDIA | 720 | 6.36 | Machinery, Equipment & Components | 591 | 5.22 | |
| UNITED KINGDOM | 676 | 5.97 | Metals & Mining | 516 | 4.56 | |
| JAPAN | 491 | 4.33 | Biotechnology & Medical Research | 487 | 4.30 | |
| CANADA | 485 | 4.28 | Real Estate Operations | 407 | 3.59 | |
| AUSTRALIA | 407 | 3.59 | Food & Tobacco | 394 | 3.48 | |
| MALAYSIA | 347 | 3.06 | Chemicals | 384 | 3.39 | |
| SWEDEN | 335 | 2.96 | Pharmaceuticals | 379 | 3.35 | |
| HONG KONG | 309 | 2.73 | Residential & Commercial REITs | 374 | 3.30 | |
| GERMANY | 303 | 2.67 | Investment Banking & Investment Services | 349 | 3.08 | |
| FRANCE | 199 | 1.76 | Professional & Commercial Services | 340 | 3.00 | |
| SWITZERLAND | 188 | 1.66 | Healthcare Equipment & Supplies | 295 | 2.60 | |
| THAILAND | 178 | 1.57 | Hotels & Entertainment Services | 278 | 2.45 | |
| TAIWAN | 175 | 1.54 | Automobiles & Auto Parts | 266 | 2.35 | |
| SOUTH KOREA | 168 | 1.48 | Oil & Gas | 263 | 2.32 | |
| ITALY | 135 | 1.19 | Construction & Engineering | 257 | 2.27 | |
| BRAZIL | 132 | 1.17 | Insurance | 251 | 2.22 | |
| SOUTH AFRICA | 118 | 1.04 | Electrical Utilities & IPPs | 249 | 2.20 | |
| TURKEY | 99 | 0.87 | Specialty Retailers | 242 | 2.14 | |
| MEXICO | 98 | 0.87 | Media & Publishing | 217 | 1.92 | |
| NORWAY | 95 | 0.84 | Semiconductors & Semiconductor Equipment | 211 | 1.86 | |
| SINGAPORE | 95 | 0.84 | Freight & Logistics Services | 174 | 1.54 | |
| INDONESIA | 83 | 0.73 | Oil & Gas Related Equipment and Services | 174 | 1.54 | |
| FINLAND | 78 | 0.69 | Telecommunications Services | 170 | 1.50 | |
| SPAIN | 73 | 0.64 | Homebuilding & Construction Supplies | 160 | 1.41 | |
| DENMARK | 67 | 0.59 | Healthcare Providers & Services | 154 | 1.36 | |
| NEW ZEALAND | 61 | 0.54 | Textiles & Apparel | 142 | 1.25 | |
| ARGENTINA | 57 | 0.50 | Electronic Equipment & Parts | 135 | 1.19 | |
| NETHERLANDS | 56 | 0.49 | Food & Drug Retailing | 127 | 1.12 | |
| BELGIUM | 54 | 0.48 | Computers, Phones & Household Electronics | 111 | 0.98 | |
| CHILE | 47 | 0.41 | Beverages | 109 | 0.96 | |
| RUSSIAN FEDERATION | 45 | 0.40 | Aerospace & Defense | 100 | 0.88 | |
| POLAND | 43 | 0.38 | Diversified Retail | 100 | 0.88 | |
| PHILIPPINES | 38 | 0.34 | Communications & Networking | 99 | 0.87 | |
| EGYPT | 35 | 0.31 | Passenger Transportation Services | 99 | 0.87 | |
| PERU | 33 | 0.29 | Construction Materials | 92 | 0.81 | |
| AUSTRIA | 32 | 0.28 | Personal &Household Products & Services | 90 | 0.79 | |
| MOROCCO | 30 | 0.26 | Transport Infrastructure | 90 | 0.79 | |
| GREECE | 27 | 0.24 | Household Goods | 88 | 0.78 | |
| VIETNAM | 26 | 0.23 | Collective Investments | 88 | 0.78 | |
| IRELAND | 22 | 0.19 | Renewable Energy | 76 | 0.67 | |
| COLOMBIA | 22 | 0.19 | Containers & Packaging | 76 | 0.67 | |
| PORTUGAL | 16 | 0.14 | Paper & Forest Products | 67 | 0.59 | |
| LUXEMBOURG | 11 | 0.10 | Consumer Goods Conglomerates | 55 | 0.49 | |
| PAKISTAN | 11 | 0.10 | Leisure Products | 54 | 0.48 | |
| ICELAND | 10 | 0.09 | Natural Gas Utilities | 54 | 0.48 | |
| ROMANIA | 10 | 0.09 | Coal | 47 | 0.41 | |
| HUNGARY | 6 | 0.05 | Holding Companies | 41 | 0.36 | |
| NIGERIA | 6 | 0.05 | Multiline Utilities | 40 | 0.35 | |
| CYPRUS | 5 | 0.04 | Water & Related Utilities | 36 | 0.32 | |
| ISRAEL | 5 | 0.04 | Financial Technology (Fintech) & Infrastructure | 34 | 0.30 | |
| CHANNEL ISLANDS | 5 | 0.04 | Miscellaneous Educational Service Providers | 26 | 0.23 | |
| CZECH REPUBLIC | 3 | 0.03 | Diversified Industrial Goods Wholesalers | 24 | 0.21 | |
| CAYMAN ISLANDS | 3 | 0.03 | Office Equipment | 18 | 0.16 | |
| BERMUDA | 3 | 0.03 | Uranium | 15 | 0.13 | |
| SLOVENIA | 3 | 0.03 | Professional & Business Education | 12 | 0.11 | |
| SLOVAKIA | 2 | 0.02 | Integrated Hardware & Software | 7 | 0.06 | |
| KAZAKHSTAN | 2 | 0.02 | School, College & University | 7 | 0.06 | |
| UGANDA | 2 | 0.02 | ||||
| BULGARIA | 1 | 0.01 | ||||
| MALTA | 1 | 0.01 | ||||
| UKRAINE | 1 | 0.01 | ||||
| JERSEY | 1 | 0.01 | ||||
| PANAMA | 1 | 0.01 | ||||
| SRI LANKA | 1 | 0.01 | ||||
| ZIMBABWE | 1 | 0.01 | ||||
| KENYA | 1 | 0.01 |
Graph 3 and Graph 4, depicts the number of return and size (market cap) observations and the number of ESG Category scores for each month in our sample.
Graph 3 Number of Observations Per Month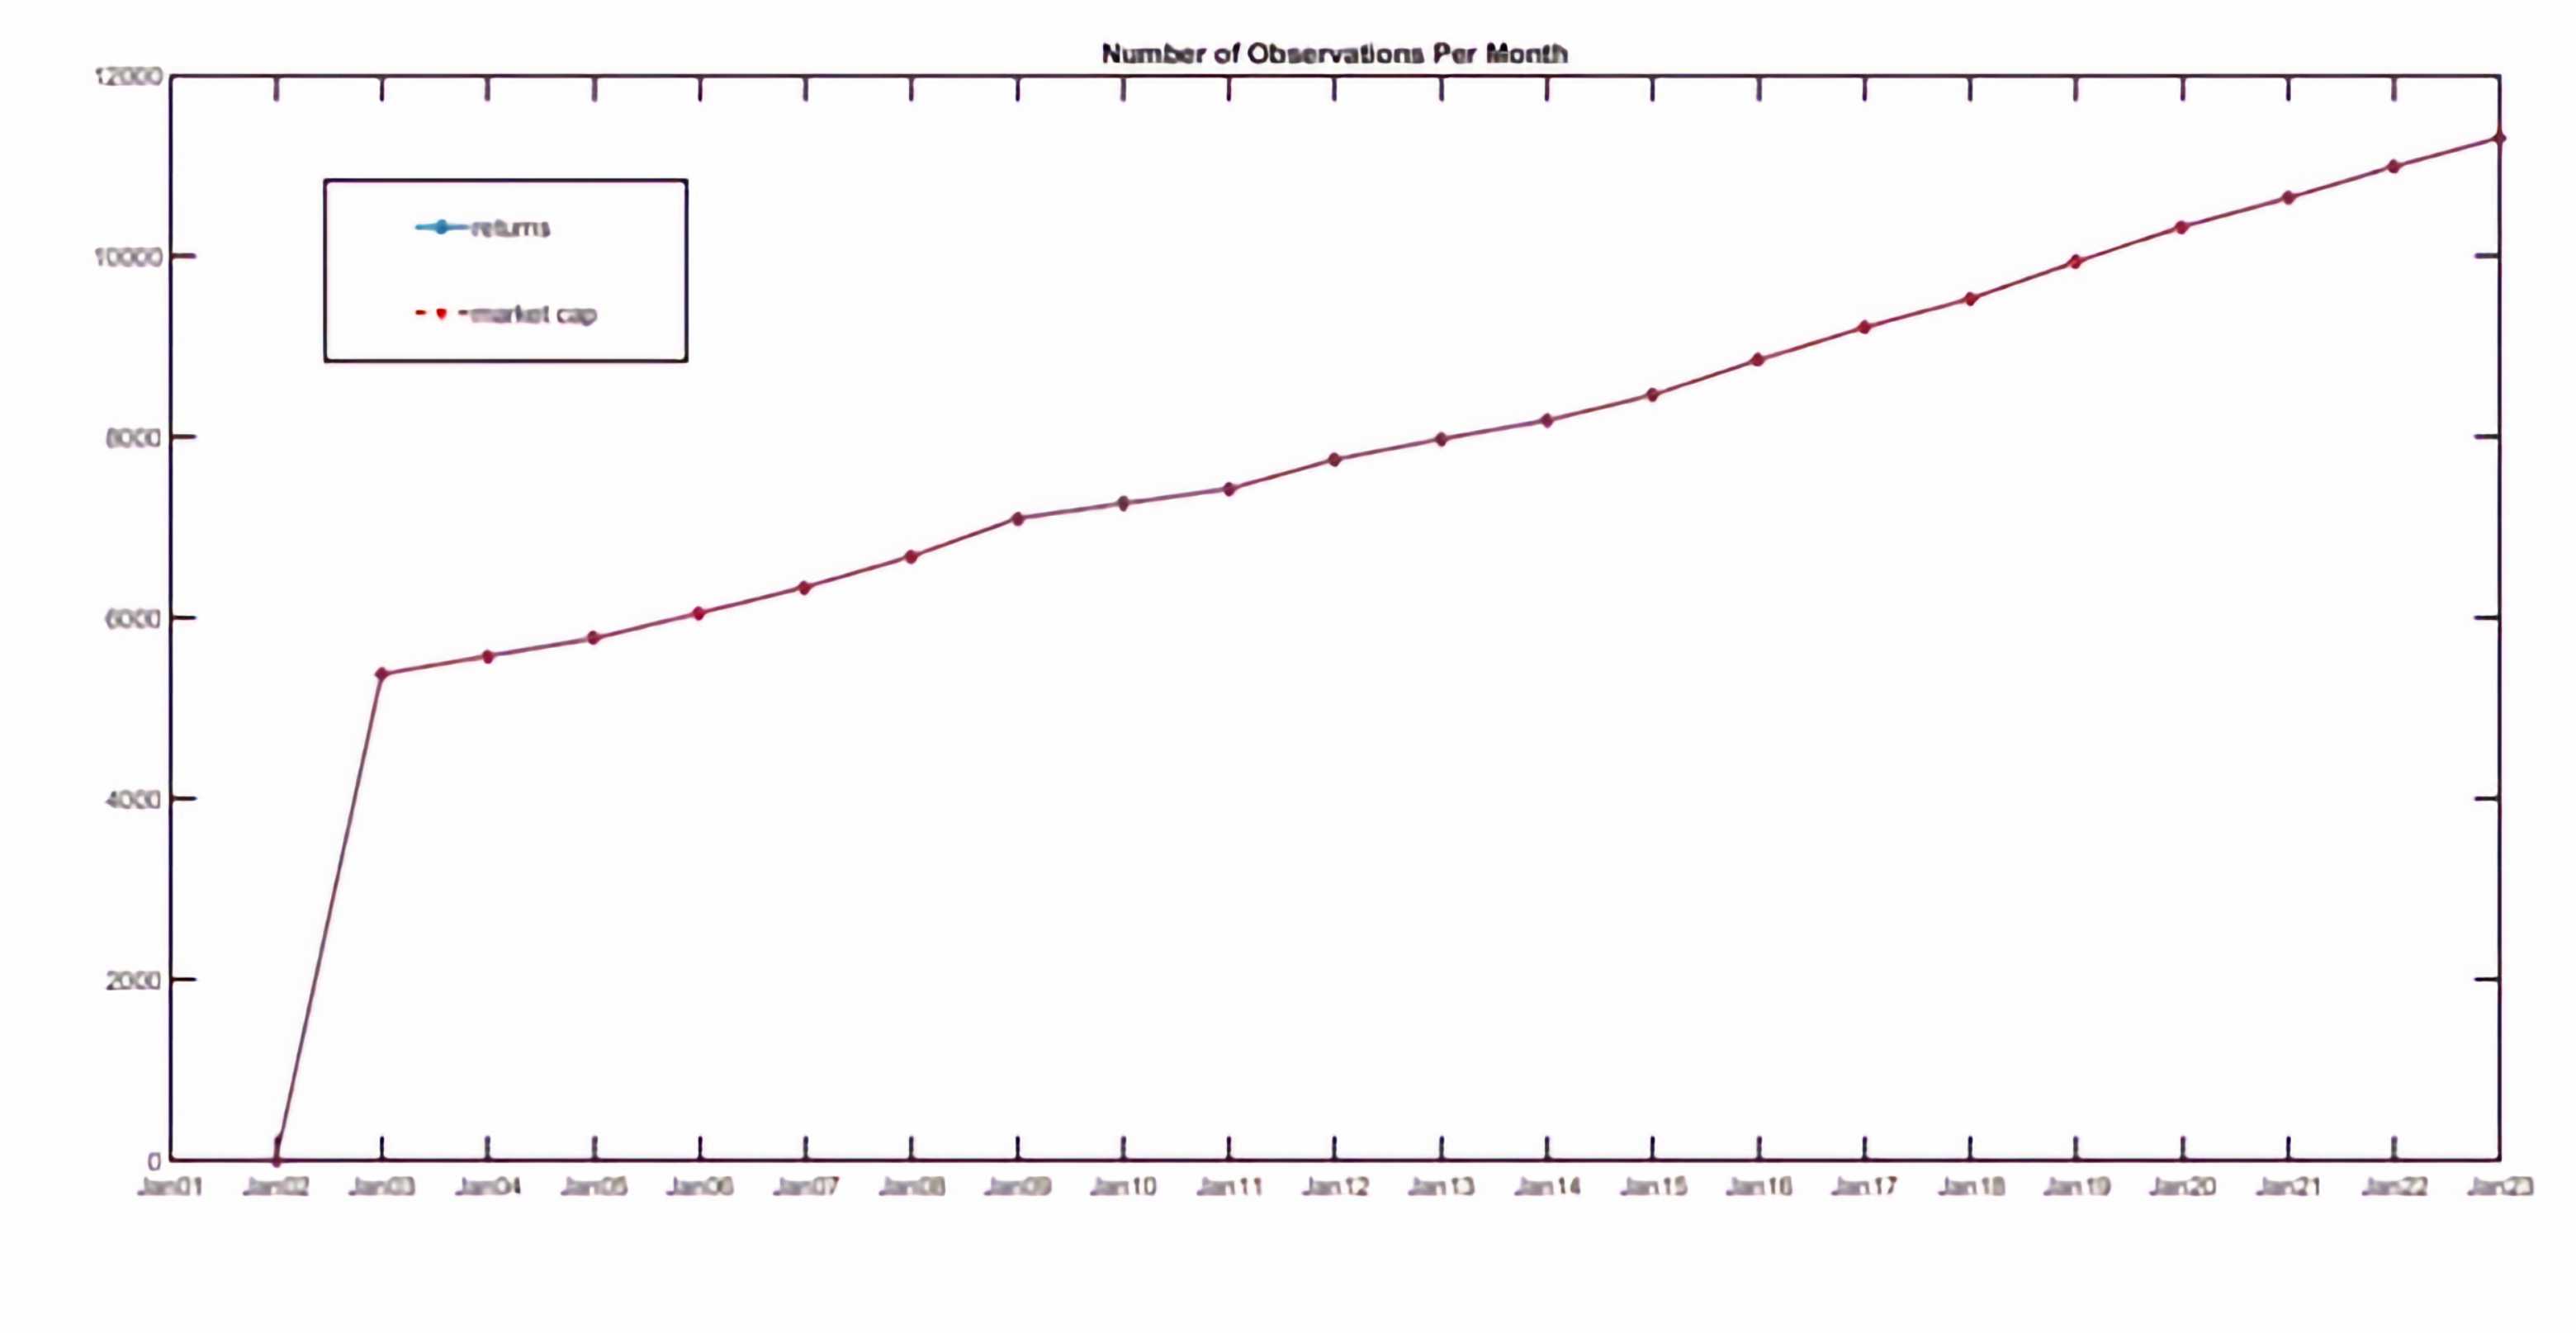
Graph 4 Number of ESG Category Scores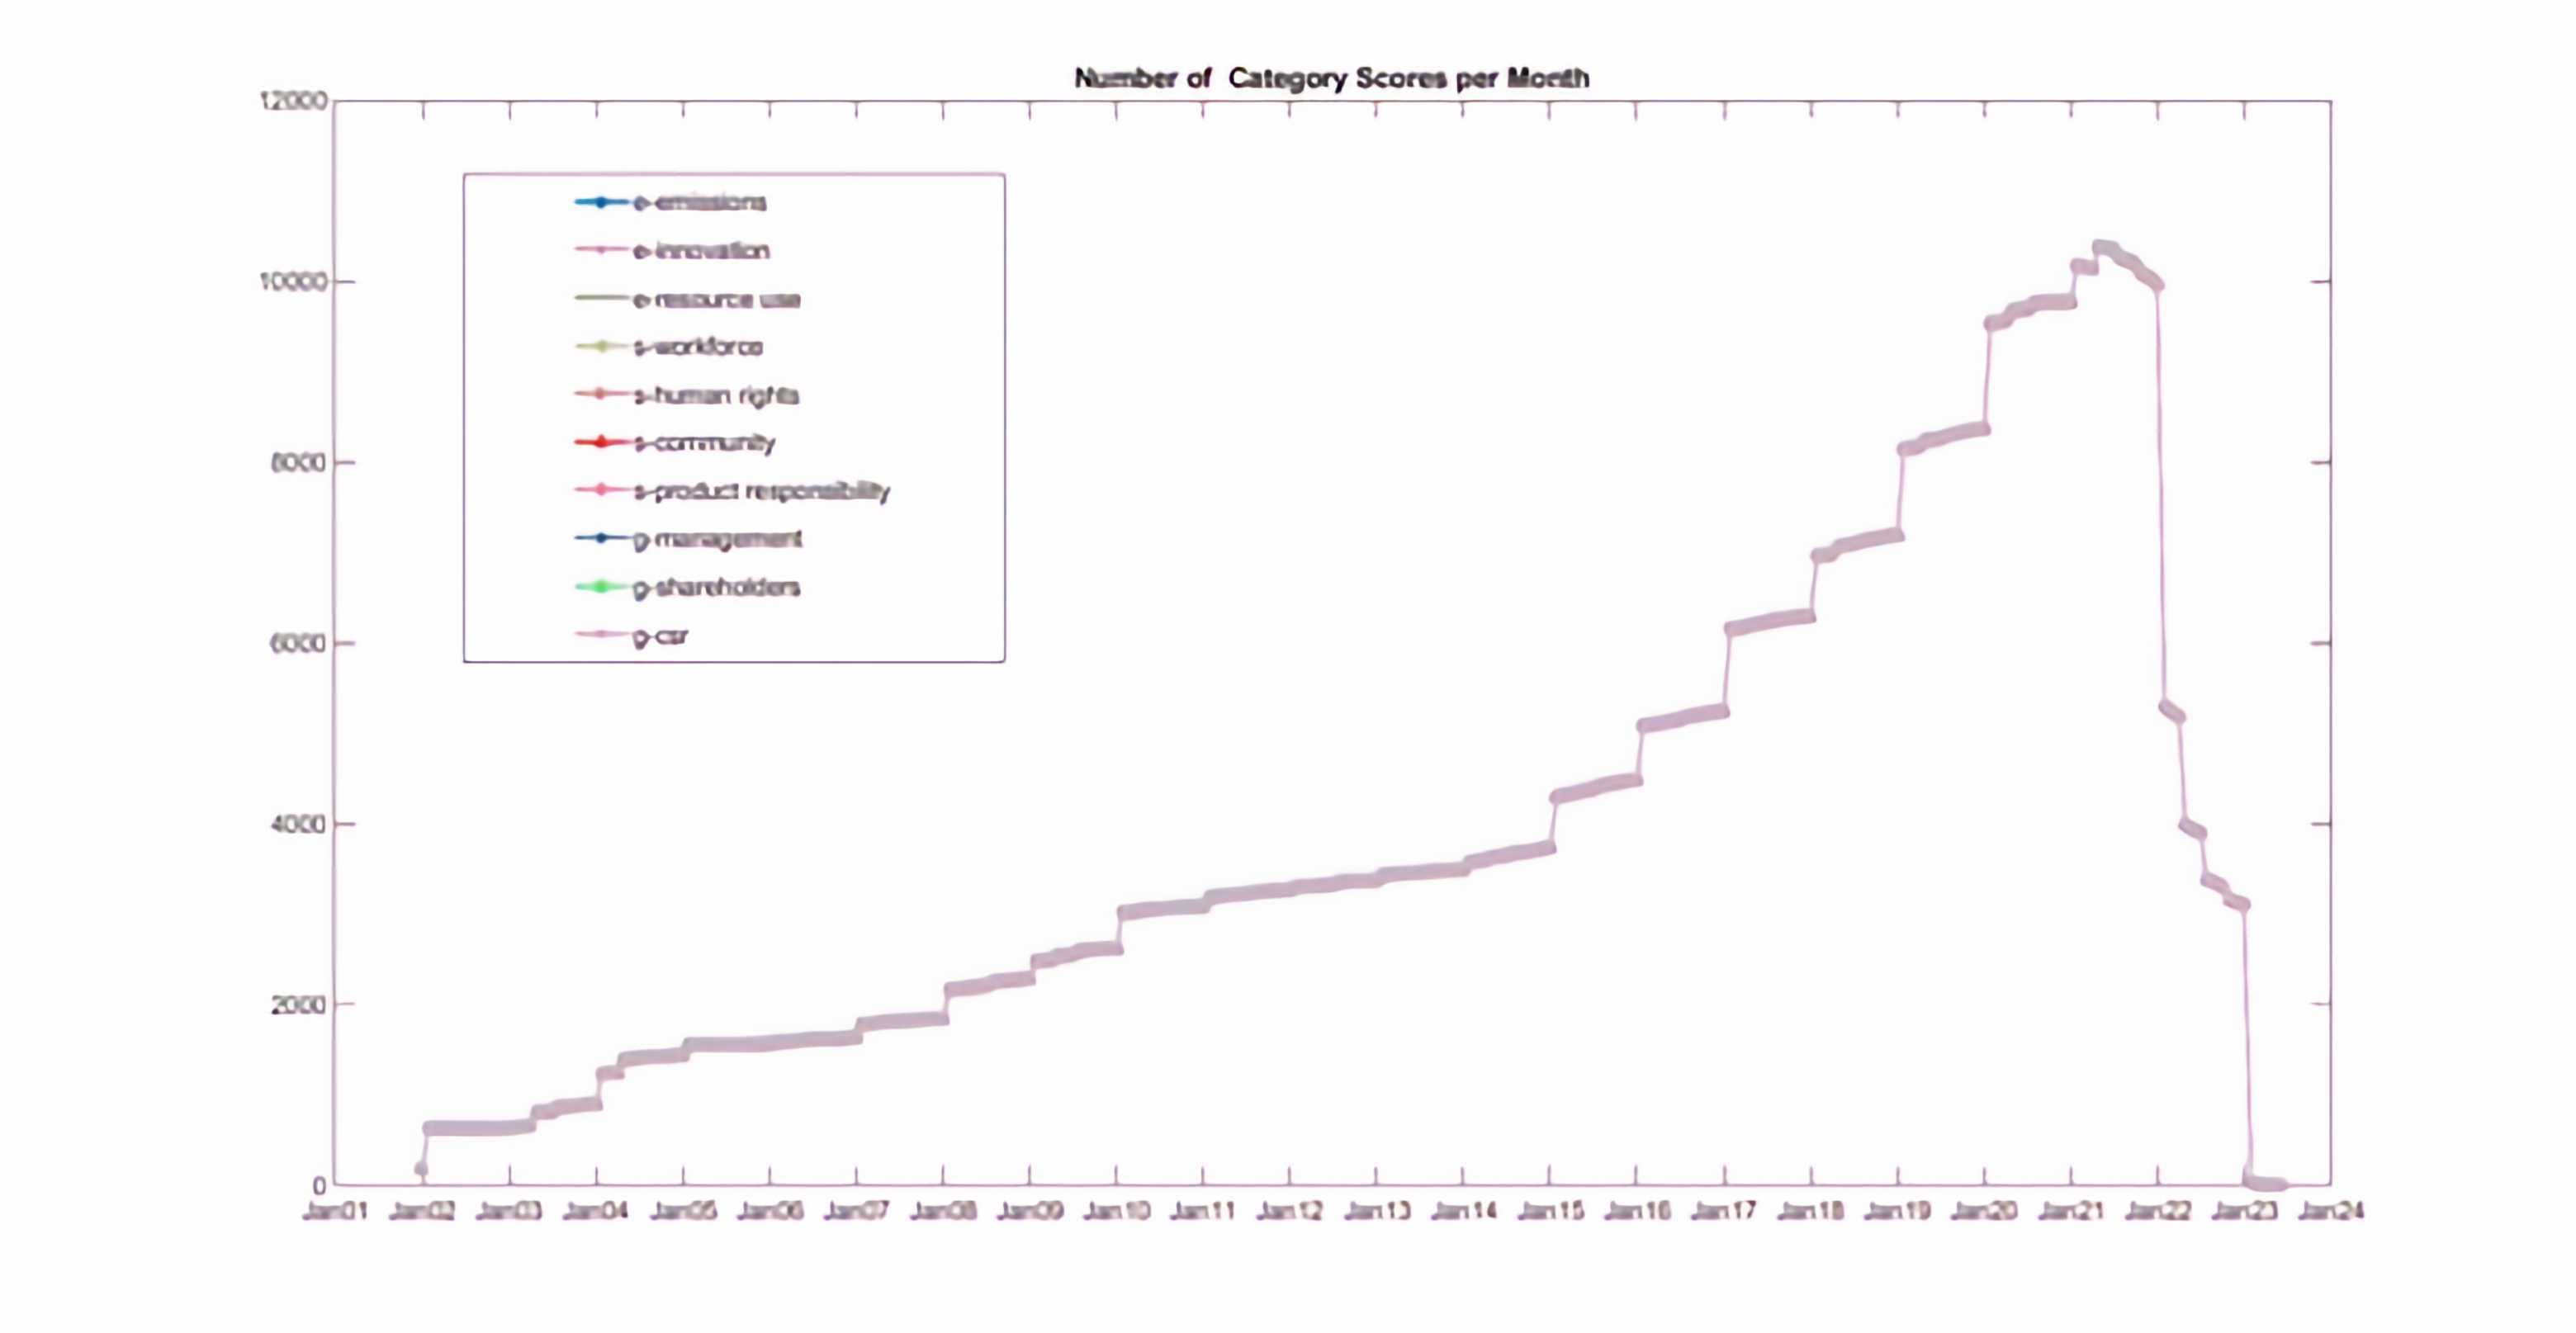
As global factor mimicking portfolios in our tests, we do use the Fama and French’s Developed Markets 3 Factors[4], while all of our univariate or bivariate sorted portfolio, uses the common methodologies of Fama and French (2015), and taking into account Landis and Skouras (2021) considerations for calculating international asset pricing factors and univariate/bivariate sorted portfolios using data from TDS.
6.3 Empirical Results
In order to investigate the cross-sectional relationship between ESG performance and stock returns, we do calculate monthly rebalancing univariate portfolio sorts based on the overall ESG and the ESG controversies scores[5]. Following the common methodology, each month, t, we use stocks with a valid market capitalization for period t-1, and a valid score for month t-6. In other words, in order to ensure that the scores will be available to investors on investment date, t-1, and avoid any instance of look ahead bias, we used scores lagged for 6 months. Table 5 reports the premium of Good ESG performers relative to Bad performers (Good Minus Bad, GMB), for the case of 5 (quintiles), 10 (deciles), 20, 30, 50, 100 (percentiles), 150 and 200 portfolios, value and equally weighted[6] (vw and ew respectively) using the overall ESG Score (Panel A) and the ESG Controversies Score (Panel B). Focusing on Panel A it is clear that as we move to more extreme Good/Bad Portfolios, the premium of Good performers increase but in line with previous research (Dorfleitner et al, 2020) the differences are not significant (Newey-West Robust standard errors and p-values are also reported in Table). It is Interesting to note that the thin premium shrinks (for instance 13 basis point vs 30 bs focusing on the case of 200 univariate portfolios) when we apply equally weighted returns, which indicates that the difference between Good and Bad performers mostly refers to Large stocks in our sample.
Table 5 Good Minus Bad Performance – Univariate Sorts
| Panel A: ESG Score | ||||||||
|---|---|---|---|---|---|---|---|---|
| #Portfolios | 5 | 10 | 20 | 30 | 50 | 100 | 150 | 200 |
| GMB vw | 0.0005 | 0.0008 | 0.0021 | 0.0018 | 0.0027 | 0.0021 | 0.0006 | 0.0030 |
| se | 0.0014 | 0.0016 | 0.0016 | 0.0016 | 0.0018 | 0.0025 | 0.0027 | 0.0028 |
| p-value | 0.7081 | 0.5959 | 0.1899 | 0.2734 | 0.1311 | 0.4085 | 0.8331 | 0.2938 |
| GMB ew | -0.0007 | -0.0003 | 0.0007 | 0.0001 | 0.0015 | 0.0014 | -0.0001 | 0.0013 |
| se | 0.0012 | 0.0013 | 0.0014 | 0.0016 | 0.0017 | 0.0024 | 0.0030 | 0.0039 |
| p-value | 0.7081 | 0.5959 | 0.1899 | 0.2734 | 0.1311 | 0.4085 | 0.8331 | 0.2938 |
| Panel B: ESG Controversies | ||||||||
| #Portfolios | 5 | 10 | 20 | 30 | 50 | 100 | 150 | 200 |
| GMB vw | -0.0001 | -0.0008 | -0.0013 | -0.0015 | -0.0018 | -0.0025 | -0.0022 | -0.0021 |
| se | 0.0006 | 0.0010 | 0.0011 | 0.0012 | 0.0014 | 0.0019 | 0.0021 | 0.0019 |
| p-value | 0.8952 | 0.4241 | 0.2366 | 0.2108 | 0.2239 | 0.2001 | 0.2899 | 0.2711 |
| GMB ew | -0.0002 | 0.0002 | 0.0001 | -0.0003 | 0.0000 | 0.0006 | -0.0001 | -0.0015 |
| se | 0.0005 | 0.0008 | 0.0009 | 0.0010 | 0.0011 | 0.0016 | 0.0017 | 0.0018 |
| p-value | 0.8952 | 0.4241 | 0.2366 | 0.2108 | 0.2239 | 0.2001 | 0.2899 | 0.2711 |
Also running Fama Mac Beth (1974) cross-sectional regression of stock returns to the ESG and ESG Controversies Scores yields insignificant results.
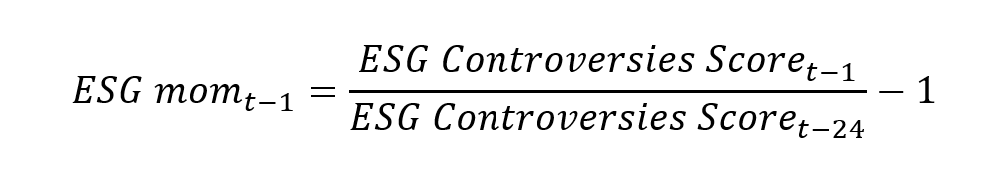
Using data from MSCI ESG database, Nagy et al (2015), document the presence of an ESG momentum. Stocks that increased there ESG performance during the last 12 months, realize higher short term returns for the period 2007 to 2014. On contrary to the results in Table 5, we document a strong ESG Momentum for the entire period 2002 – 2023. Stocks which tend to increase their ESG performance during months t-24 to t-1, tend to realize high abnormal returns. Our metric for the ESG momentum is defined as:
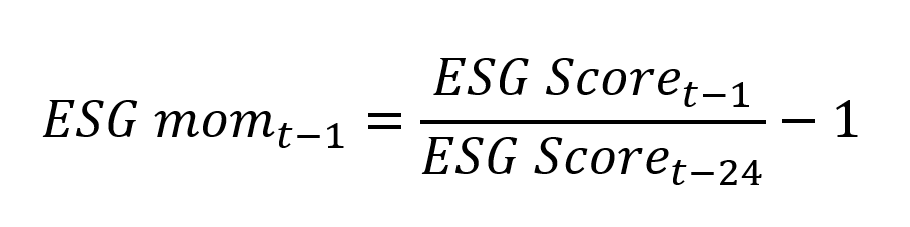
Figure 8 plots the value of 1 $ invested in a value weighted GBM portfolio using 100 univariate sorted portfolios on ESG momentum for the period 2004-2023.
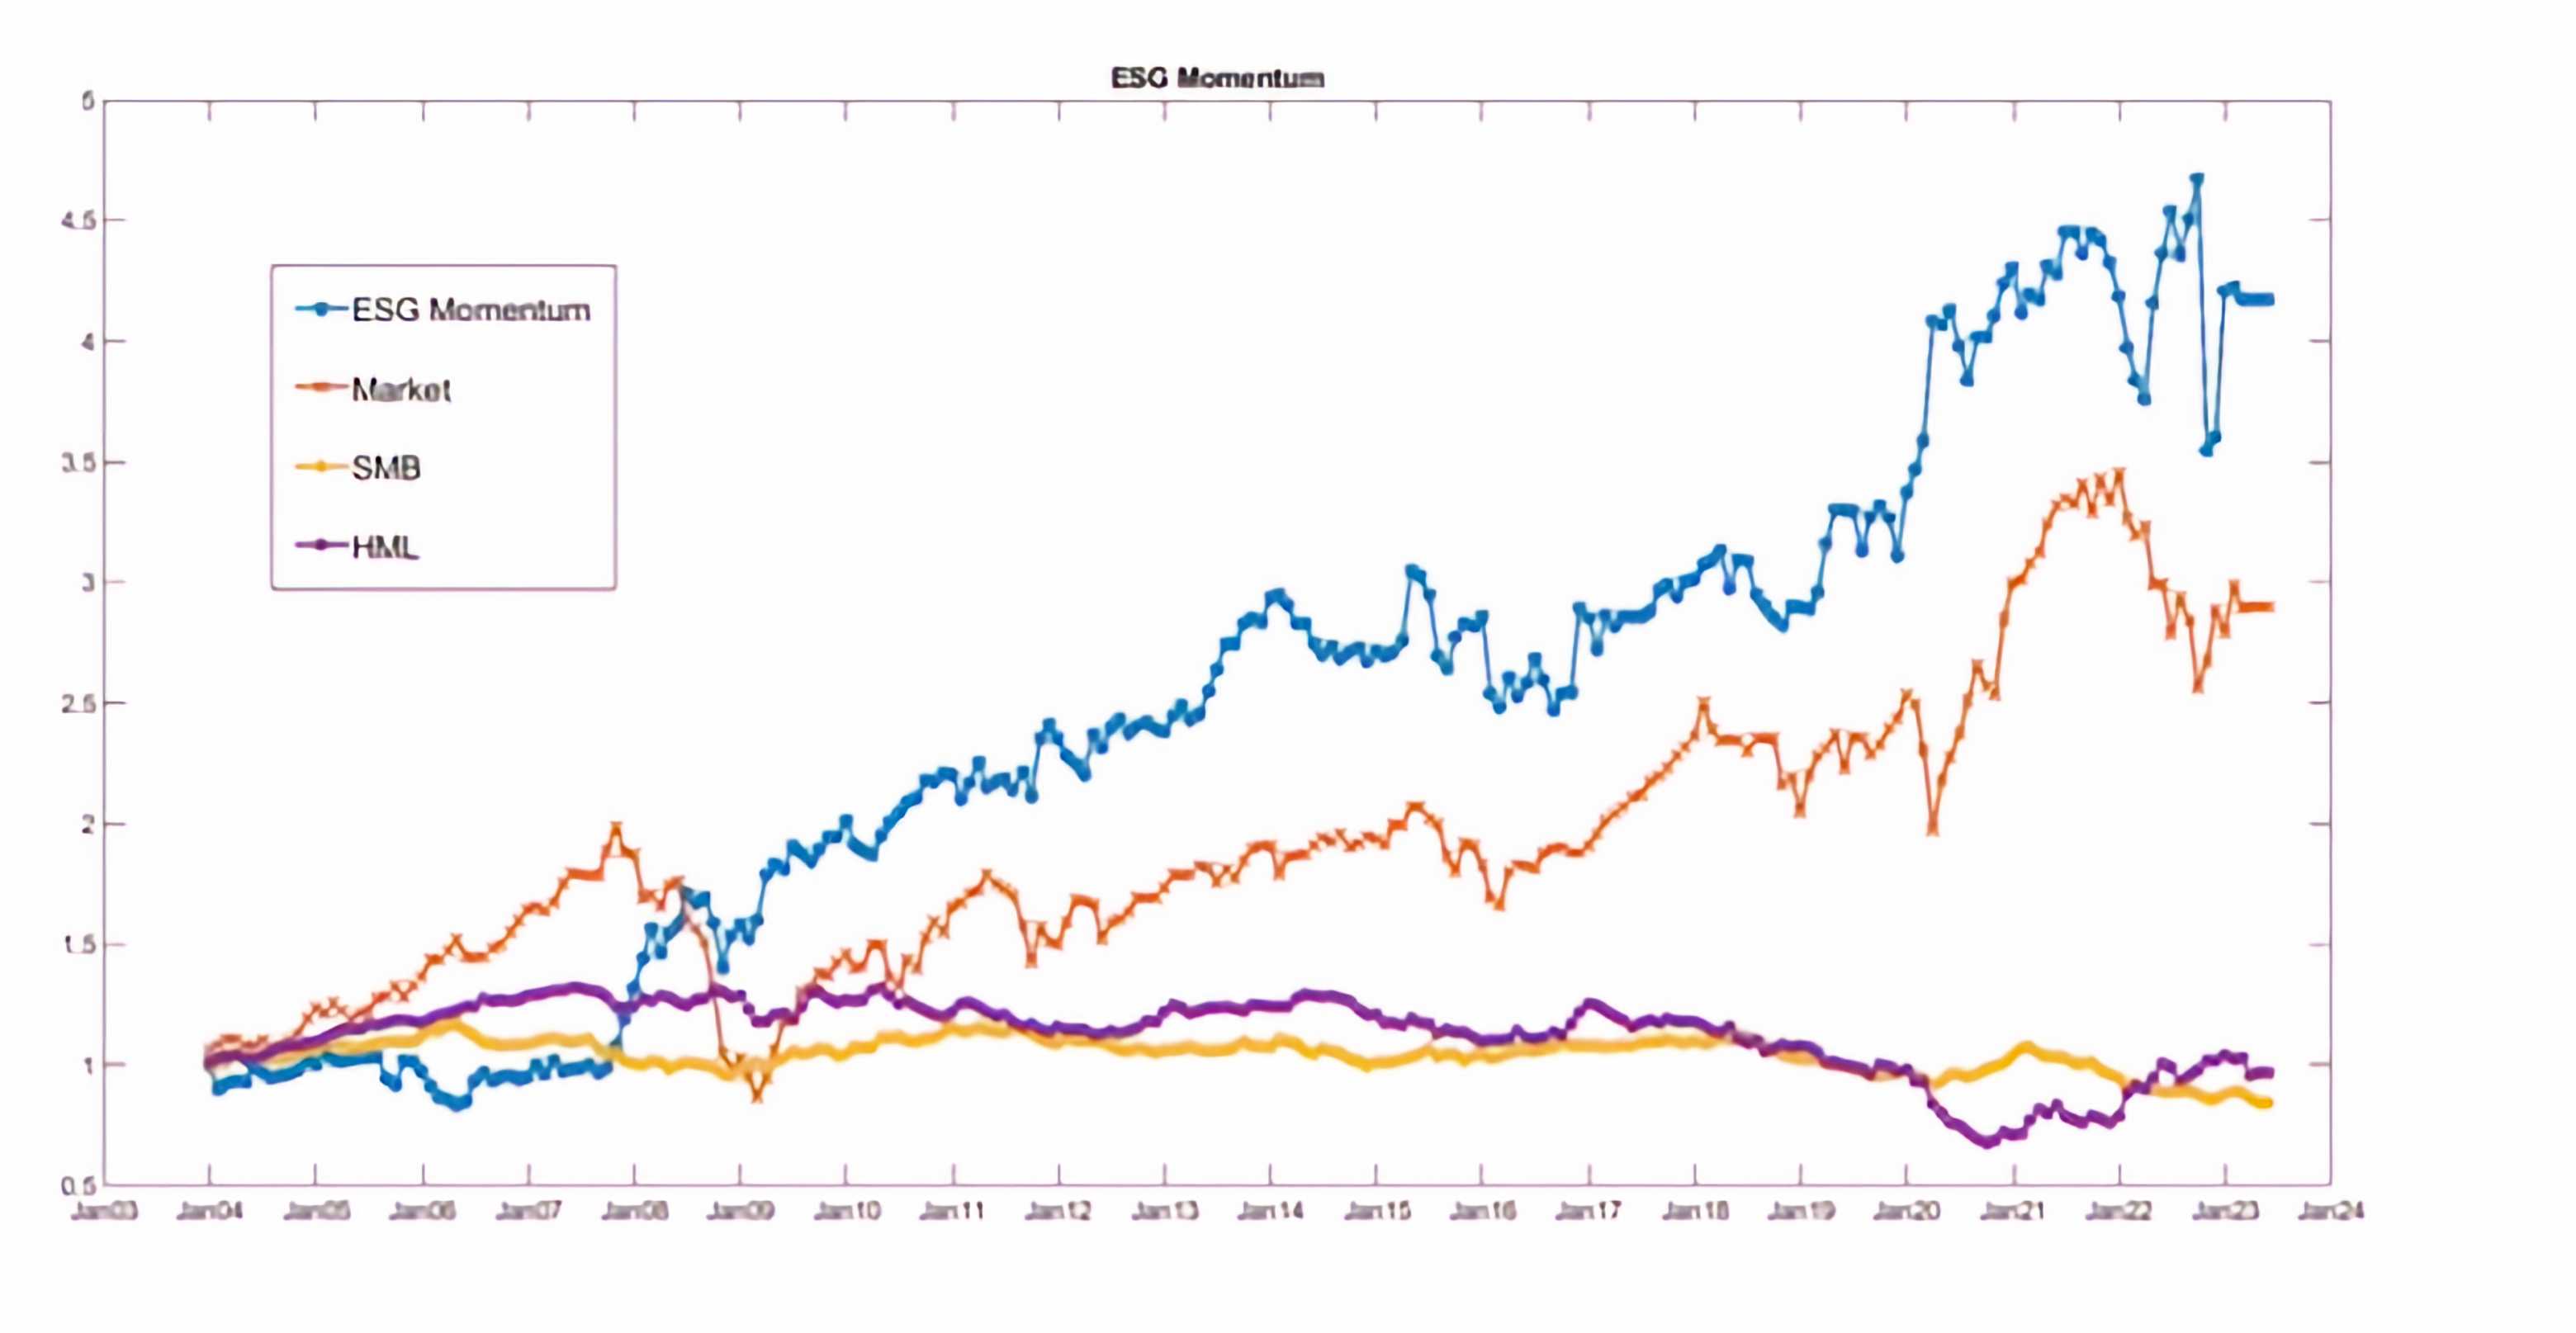
The average monthly return of the GBM extreme portfolios is 0.73%, highly significant with a Newey West Robust standard error of 0.0027 (NW t-stat = 2.70), an annualized Sharpe ratio of 0.55. Using the Fama French methodology, a bivariate monthly rebalancing ESG momentum GMB factor mimicking portfolio, sorted on size and ESG momentum is calculated and presented in Figure 9. Following the methodology of Fama and French (FF) for the international returns, Big stocks are those in the top 90% of market cap for the region, and small stocks are those in the bottom 10%[7].
Figure 9 ESG Momentum Factor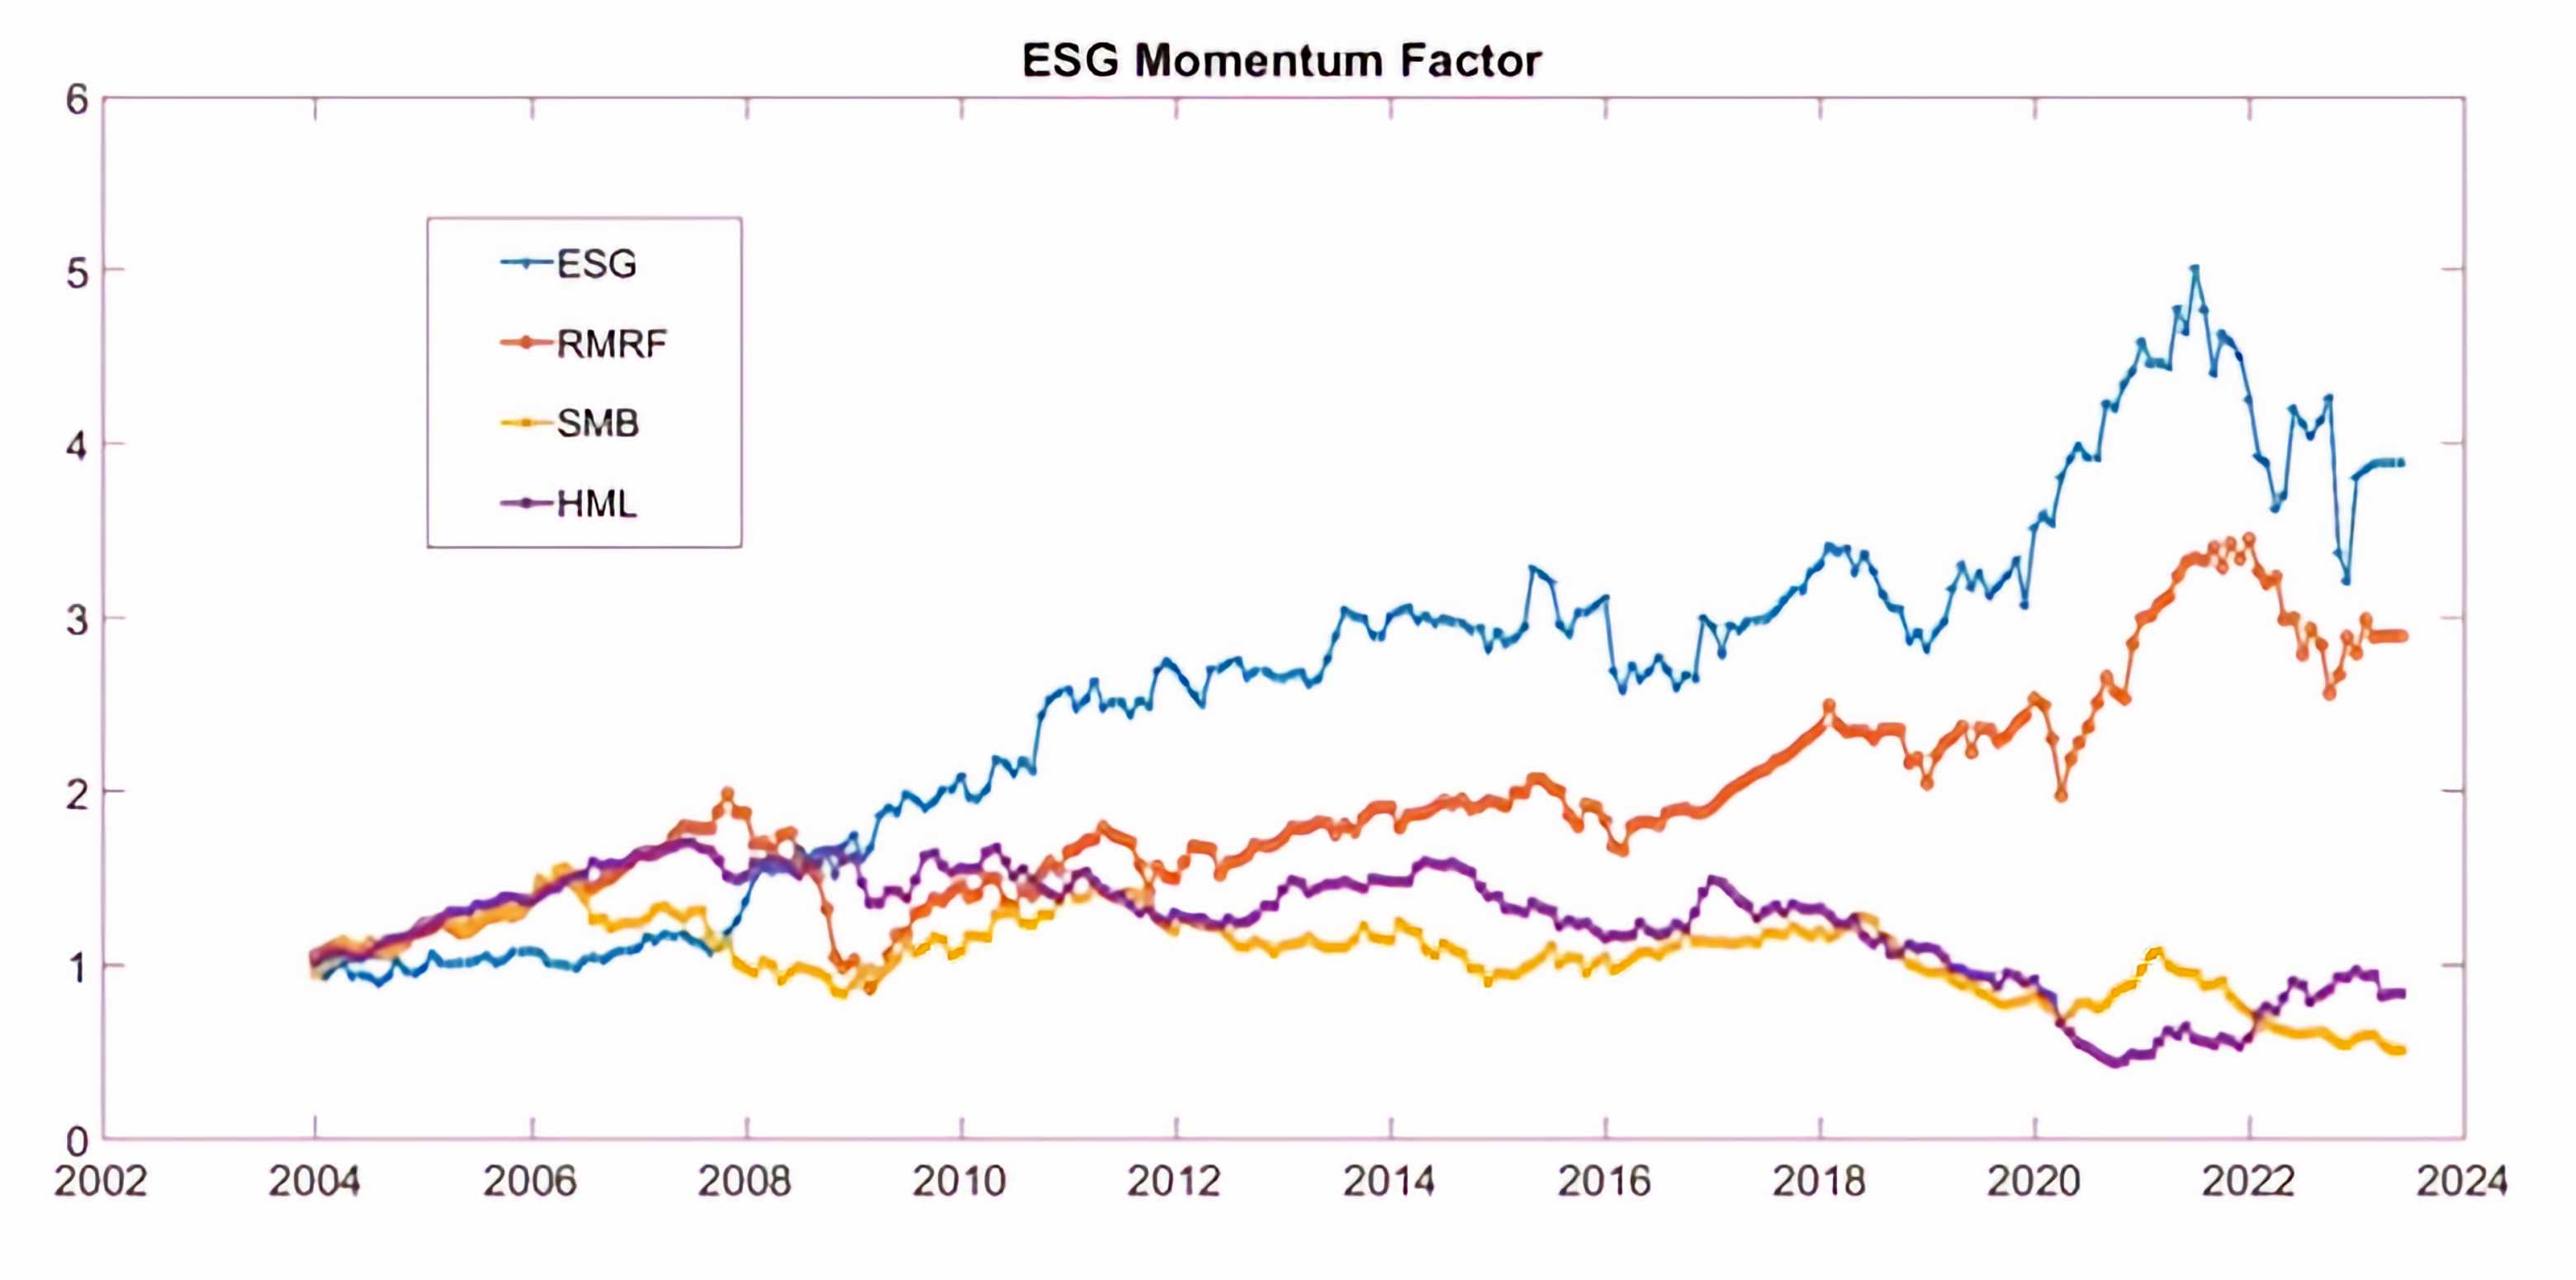
Apart from the ESG performance, as measured with the ESG Score, the momentum in the ESG controversies is also a strong effect for the entire sample period 2002-2023.
The controversies momentum is defined as:
By definition, TRF Controversies Score account for differences between industries and in relation to companies’ size, due to the fact that Big companies tend to attract more media attention. In our sample, it is also expected that heterogeneity in countries, possibly in countries and sectors also, would be significant. In this direction, we do calculate the univariate sorted portfolios hedging for country and sector returns. Hedging is applied on the holding returns by subtracting from the monthly stock return, the mean return of all stocks incorporated in the same industry and country.
Figure 10 presents the value of 1 dollar invested in a value weighted GMB Controversies Momentum Portfolio, using 10 univariate sorted Portfolios on Controversies Momentum.
Figure 10 ESG Controversies Momentum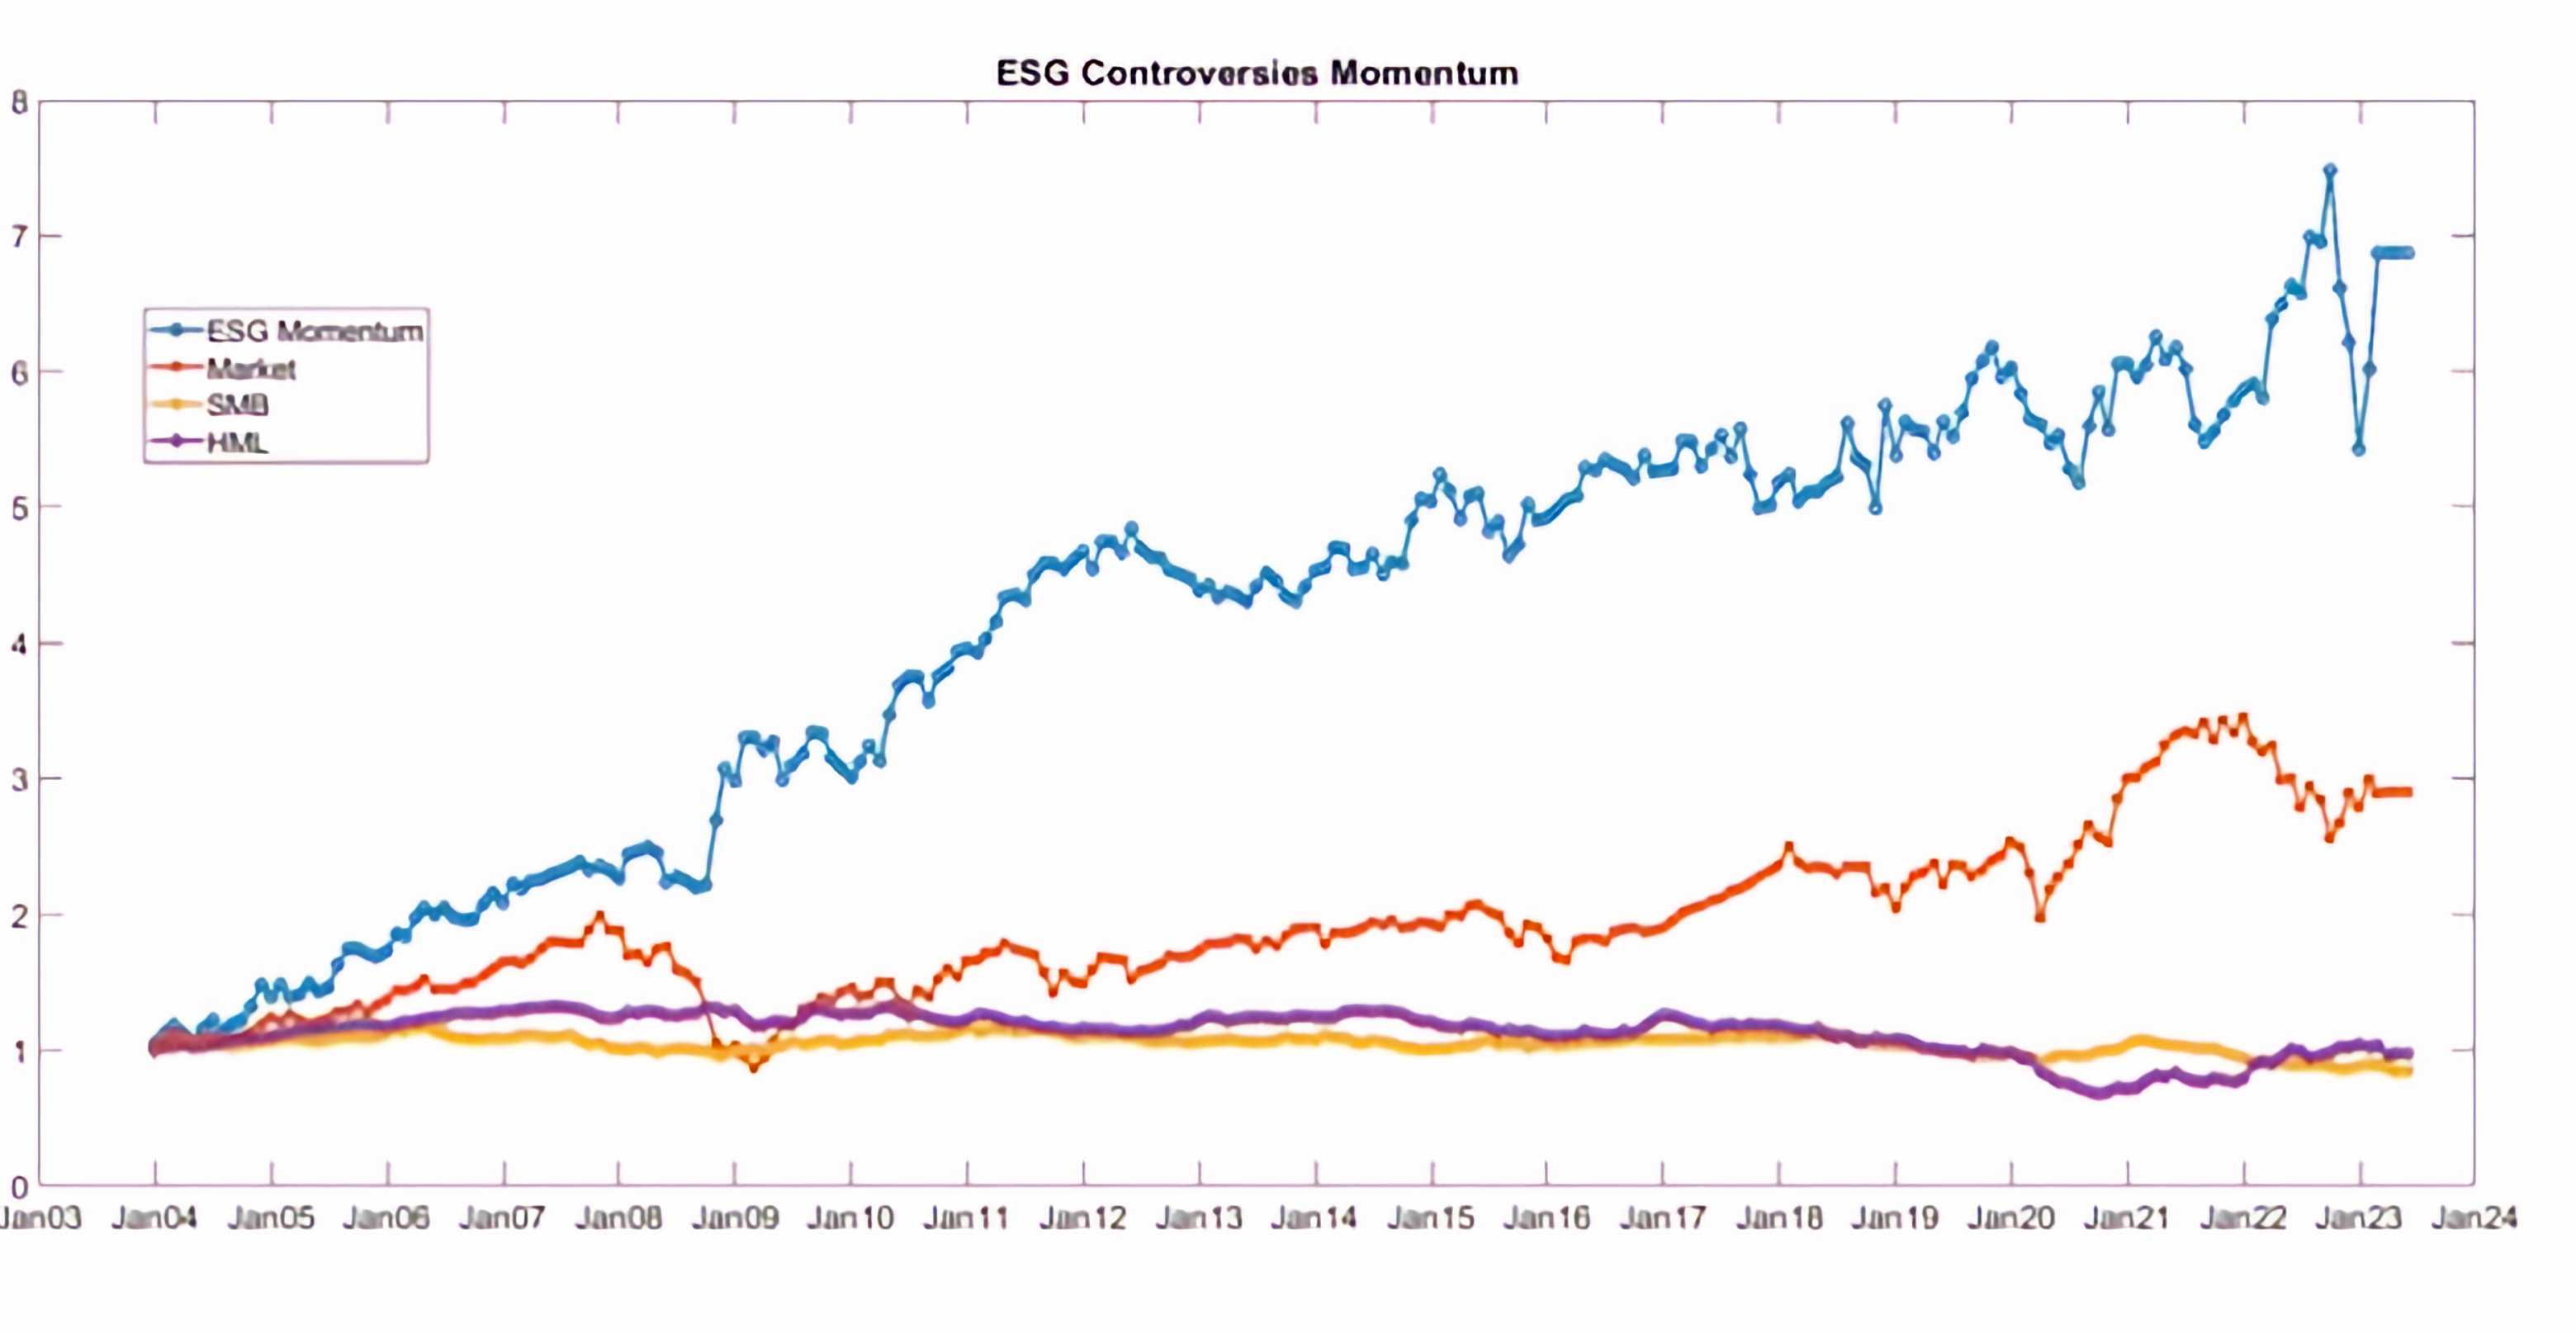
The GMB strategy has an average monthly return of 0.26% with a Newey-West t stat equal to 3.58.
In order to account for both effects, the combined Factor is calculated using the sum of the two scores, that is:

Combined ESG scores are normalized to [0,100].
Figure 11 presents the decile GMB value weighted performance, again hedged against stock’s country and market. Portfolio has an average return equal to 0.0028, a t-stat equal to 2.66 and an annualized sharpe ratio equal to 0.55.
Figure 11 GMB Combined ESG Momentum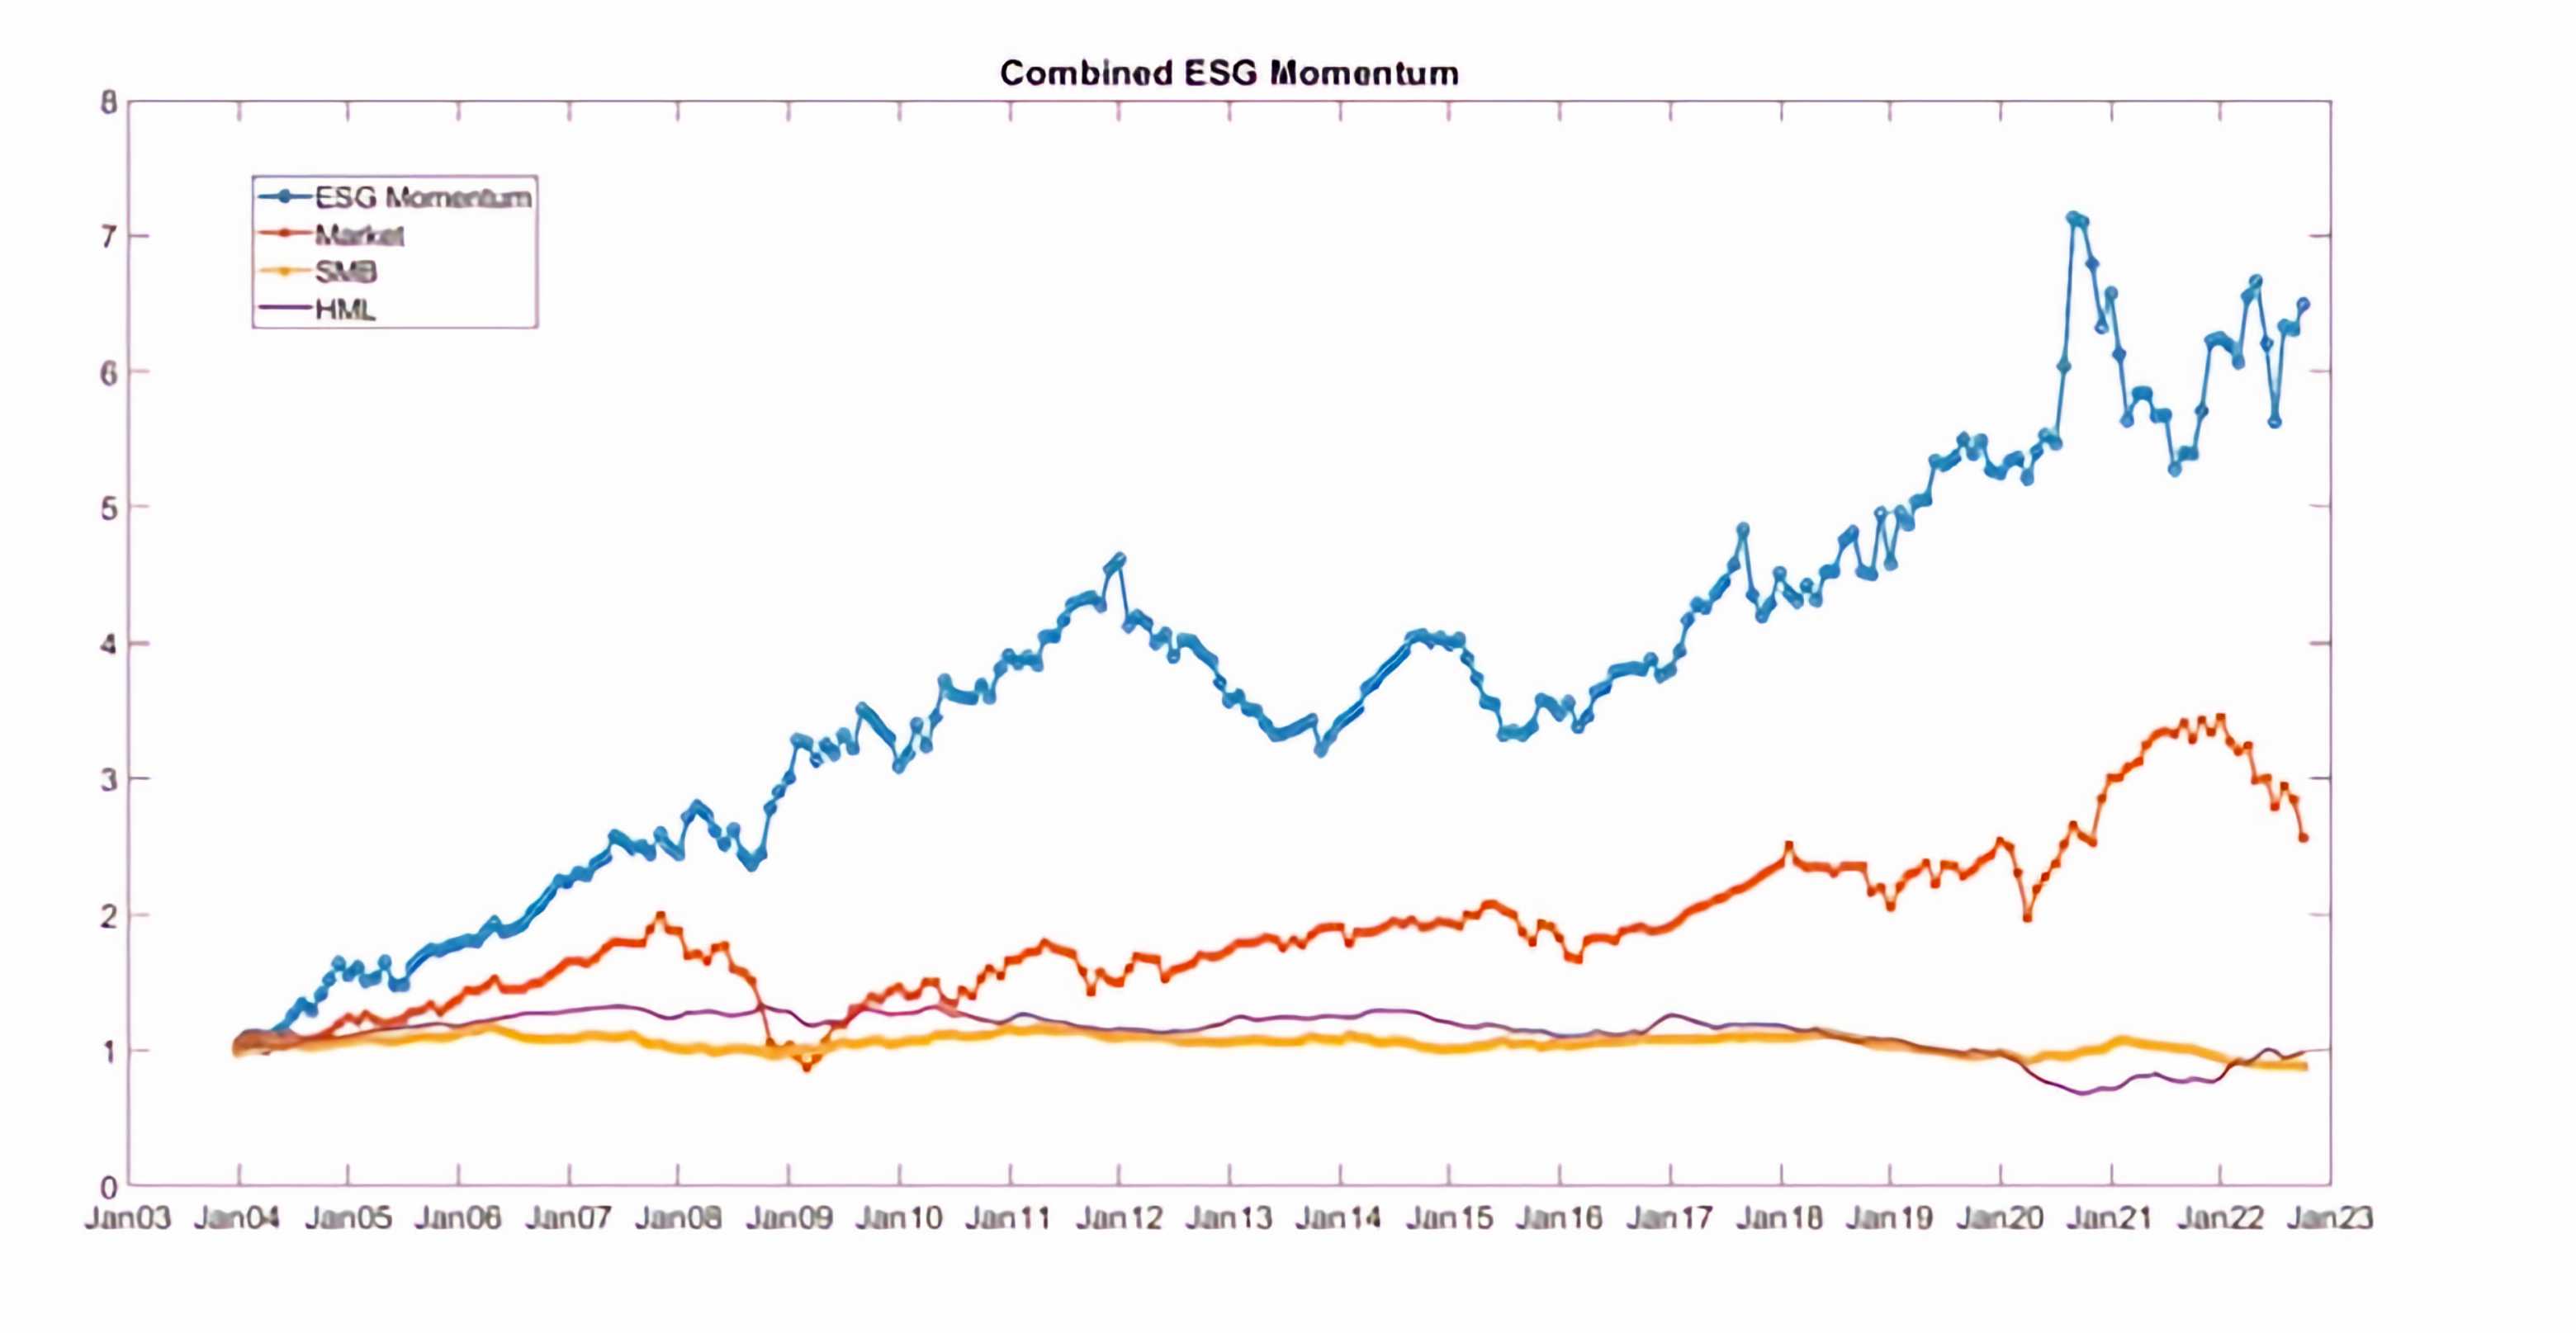
Figure 12 presents a double sorted Factor ESG Momentum Mimicking portfolio based on the 90% breakpoint for Size and [30,70] breakpoints for the Combined ESG Momentum.
Figure 12 Combined ESG Momentum Factor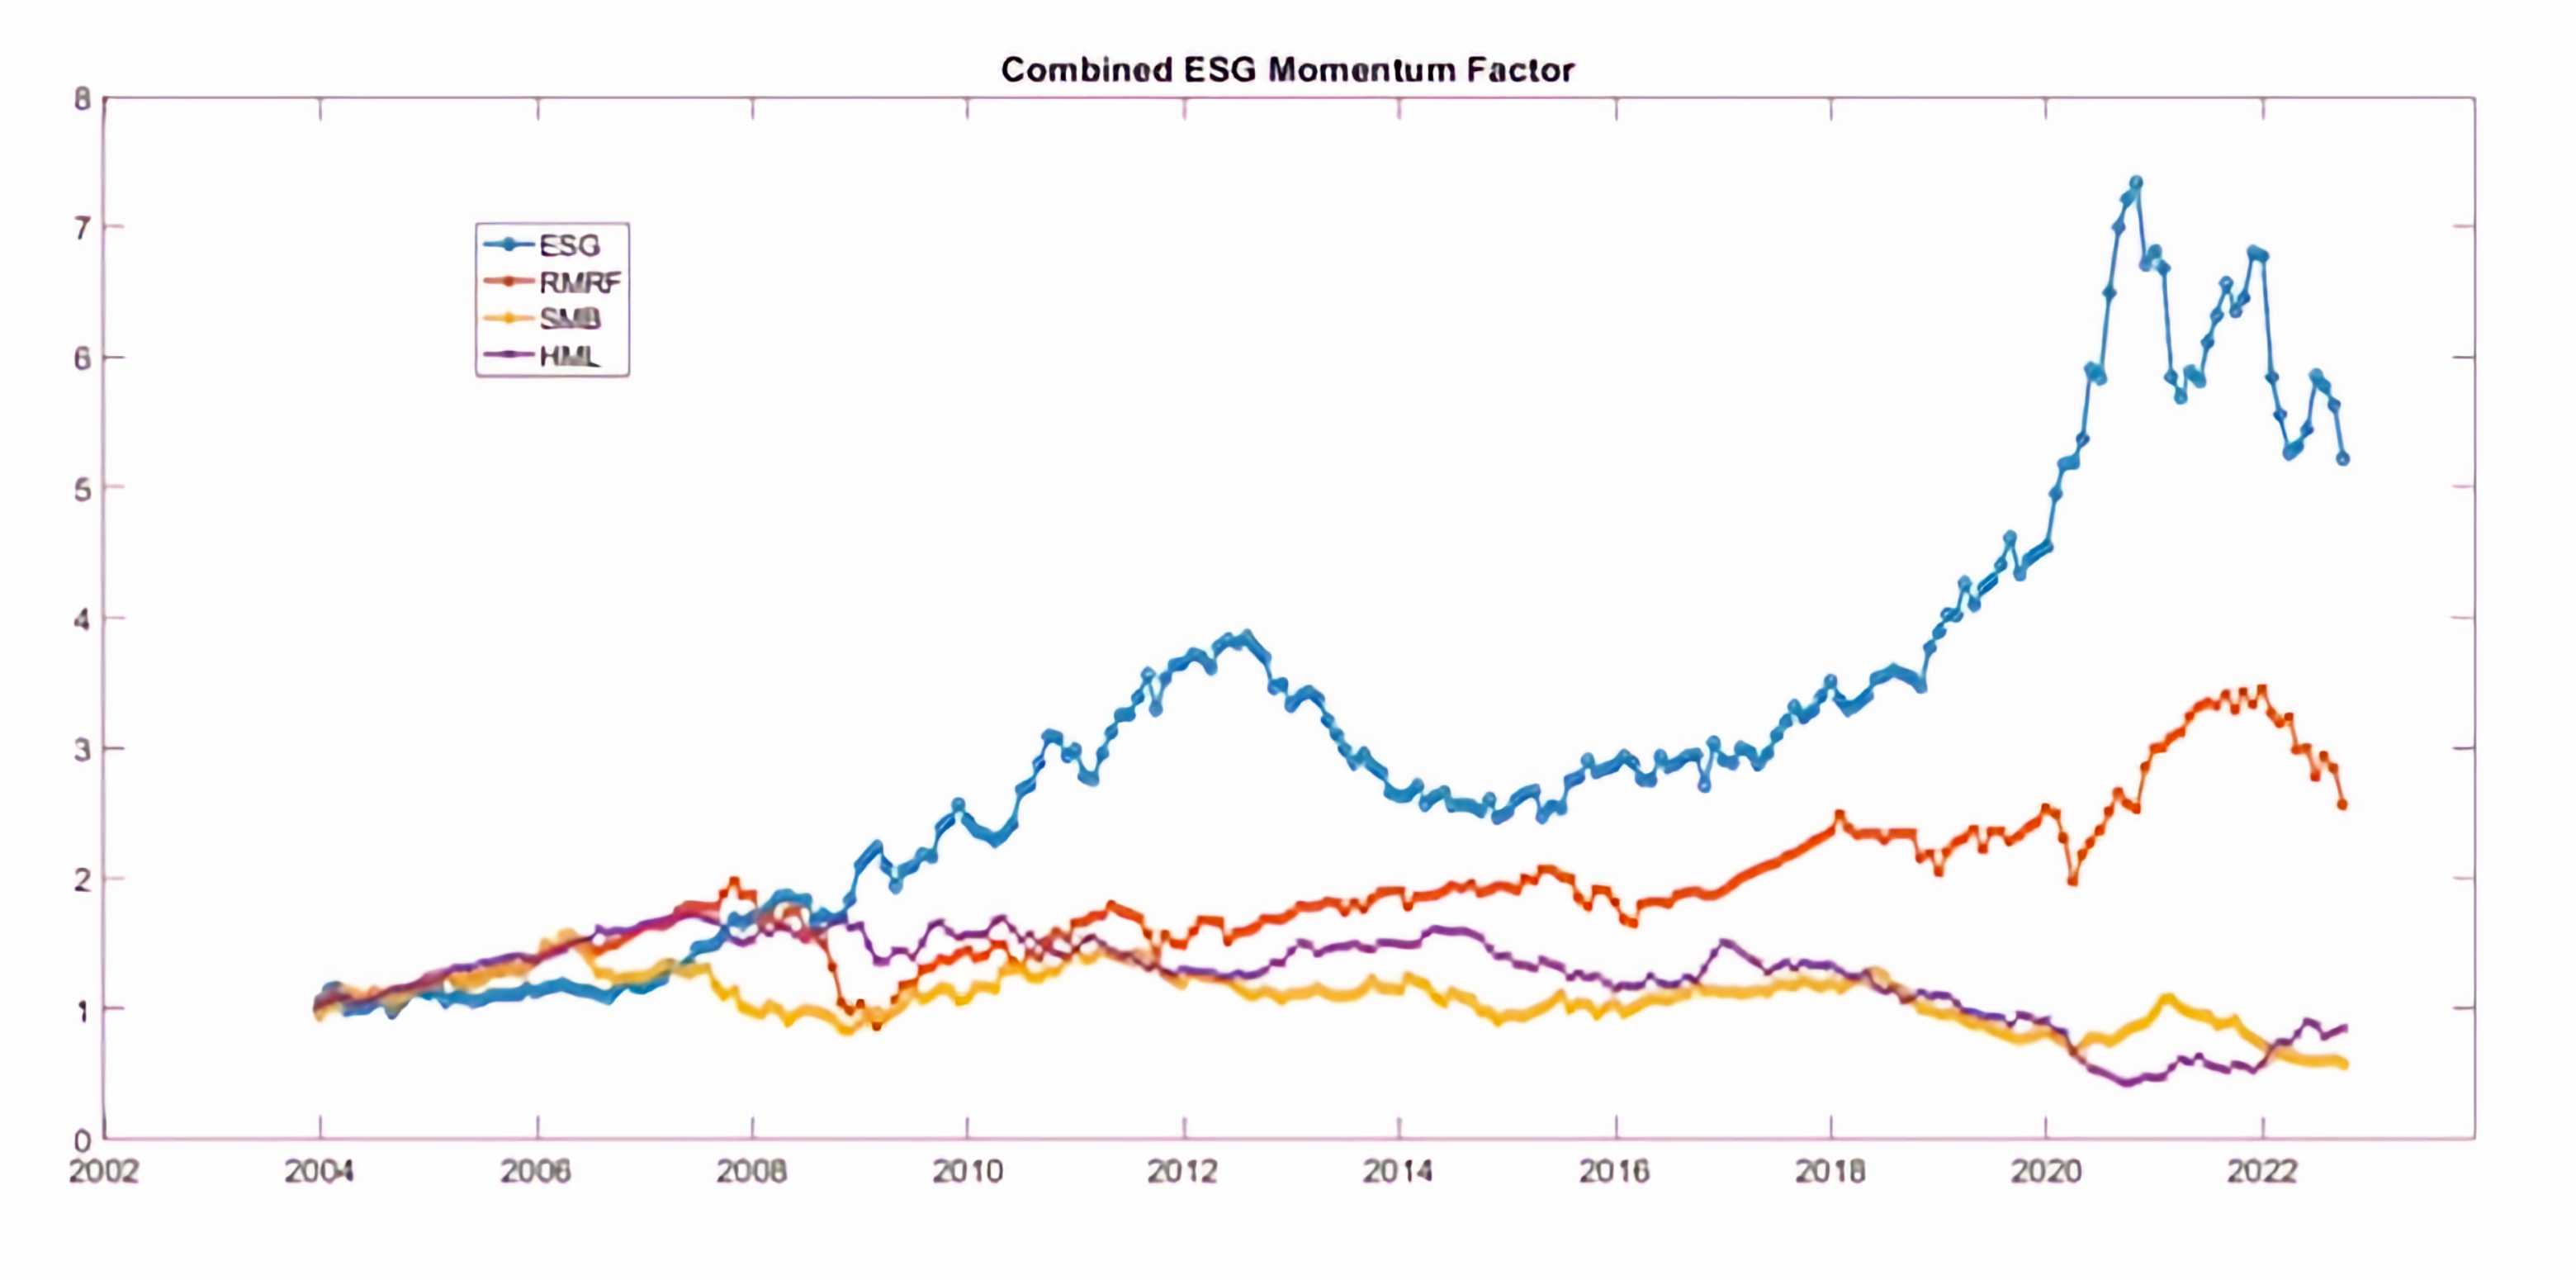
Factor has a significant average return of 12bs (t-stat = 2.42) and an annualized sharpe ratio equal to 0.53. A Fama Mac Beth (FMB) cross sectional regression, where the holding period returns for all stocks are regressed to the combined ESG momentum signals, yields an FMB beta equal to 0.01%, with a hac robust tstat of 4.1.
In the same direction with Henriksson et al (2018), we find that the returns continue to increase and be significant for at least 12 months after portfolio formation. Figure 6 reports the results from FMB cross-sectional regressions of future returns (t+1 to t+12) to ESG Momentum Signals (based on periods t-24 to t-1).
Table 6 ESG Momentum Future Returns
| Holding Period | Beta | HAC se | HAC tstat |
|---|---|---|---|
| t | 0.06 | 0.004 | 4.1 |
| t to t+1 | 0.03 | 0.01 | 4.06 |
| t to t+2 | 0.05 | 0.01 | 4.26 |
| t to t+3 | 0.07 | 0.02 | 4.37 |
| t to t+4 | 0.09 | 0.02 | 4.64 |
| t to t+5 | 0.11 | 0.02 | 4.59 |
| t to t+6 | 0.12 | 0.03 | 4.68 |
| t to t+7 | 0.14 | 0.03 | 4.57 |
| t to t+8 | 0.15 | 0.03 | 4.49 |
| t to t+9 | 0.15 | 0.04 | 4.41 |
| t to t+10 | 0.16 | 0.04 | 4.28 |
| t to t+11 | 0.16 | 0.04 | 4.15 |
| t to t+12 | 0.16 | 0.04 | 4.06 |
In order to provide an example of the applicability of our factors, we do calculate 20 portfolios univariate sorted on ESG Momentum Controversy, the FF three factor model produces an average absolute alpha of 0.0015 and a GRS test for all portfolios equal to 2.73 (p-value 0.0035), while a 4-factor model expanded to include our Combined ESG Momentum factor exhibits an average absolute alpha of 0.0010 and a GRS test of 2.05 (p-value=0.012).
6.4 Integrate Sustainable Development Goals
Since the Late 2000’s ESG integration focused primarily on assessing the ESG policies and processes of companies to evaluate the companies best managing these issues, and which issues were material to the financial prospects of the company, then overweighting or underweighting the companies accordingly.
With the launch of the United Nations SDGs in 2015, this started to change. Endorsed by 193 countries, the SDGs address topics including poverty, hunger, health, education, climate change, gender equality, water, sanitation, energy, environment, and social justice. Achieving the goals requires an estimated investment of USD 5 trillion to USD 7 trillion per year until 2030. For every year that passes, the investment needed to fulfil these goals increases, highlighting the urgency of mobilizing capital. Since 2015, the SDGs are gaining ground as a reference point for investors to align investments and impact goals. This has not only added an additional layer of analysis on top of the traditional exclusion and ESG but underline the need for the creation of a suite of additional attractive investment opportunities that are ‘impact-aligned’ to the SDGs. Agenda 2030 and the Sustainable Development Goals (SDGs), adopted by all member states of the United Nations in 2015, describe a universal agenda that applies to and must be implemented by all countries and all stakeholders at a local level and in any instance of economic activities. Sound metrics and data are critical for turning the SDGs into practical tools for problem solving. UN SDSN partners with a variety of organizations to assess progress towards SDG achievement at the national level and the local level. Both official and unofficial metrics are used to measure distance to targets for each of the SDGs to identify priorities for action, understand key implementation challenges, track progress, ensure accountability, and identify gaps that must be closed in order to achieve the SDGs by 2030. The SDSN methodology (Sachs et al., 2020) was audited by the EU JRC in July 2019.
Sachs et al (2019) suggests an approach of making the SDGs operational for governments and policymakers, based on Six Transformational themes, while Koundouri et al. (2021,2022) propose a methodology to map European Green Deal policy documents to the SDGs. Further, Koundouri et al. (2022) present a methodology to assess the degree that the National Recovery and Resilience Plans (NRRPs) of NextGenerationEU program, support the SDGs, and apply it on the NRRPs of 7 European countries.
Koundouri et al (2023b) provides a holistic three step approach for the integration of the Sustainable Development Goals into the sustainability reporting of companies. Process requires the use of an extend set of sector-specific and generic Environmental, Social and Governance Key Performance Indicators (KPIs) based on a series of accounting standards and frameworks, measured across the value chain of the company.
The above framework can be integrated in the portfolio construction, to provide meaningful implications related to the exposure of financial assets to SDGs.
Figure 7 presents the Pillars and the Material categories used in the TRF metrics.
Table 7 TRF ESG Categories
| ESG Categories | Material Issues / Categories |
|---|---|
| Environmental | Emissions |
| Environmental Innovation | |
| Resource Use | |
| Biodiversity | |
| Social | Workforce |
| Human Rights | |
| Community | |
| Product Responsibility | |
| Governance | Management |
| Shareholders | |
| CSR |
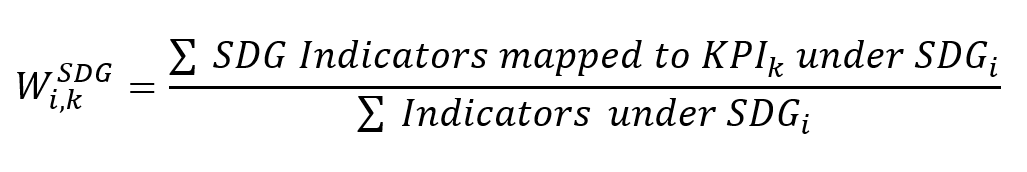
Following a similar methodology to Koundouri et al (2022), we map the ESG categories to SDGs. The mapping methodology refers to map individual key performance indicators to specific SDG indicators using the most updated list of the 169 indicators for the 17 SDGs.
Consider i=1, … ,17 refers to the 17 SDGs. Also consider k=1,…, K, refers to the Individual KPIs in analysis. Then the raw SDG weights for each kpi refers is calculated as follows:
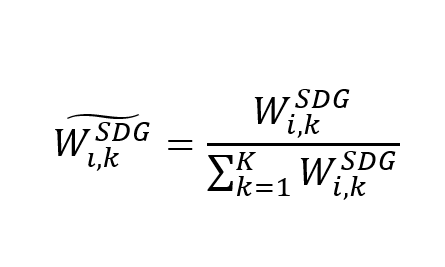
Raw weights are normalized so that the sum of weights to sum to one:
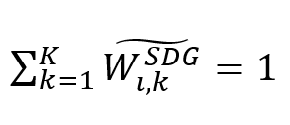
Note that:
The holistic interdependent relationship of the 3 Pillars and the 17 Sustainable development goals (SDGs) is presented in using a Sankey diagram in Figure 6.7. The SDG weights for each category/ pillar are calculated as the average weight of all KPIs used in each material issue category/ pillar. Analysis in the SDG context is more holistic and reveals the interconnections between the ESG KPIs, where the most common ESG related scores are agnostic.
Koundouri and Landis (2023) provide an extent set of examples as well as robustness checks for the above methodology.
Figure 13 ESG Pillars Map to SDGs 1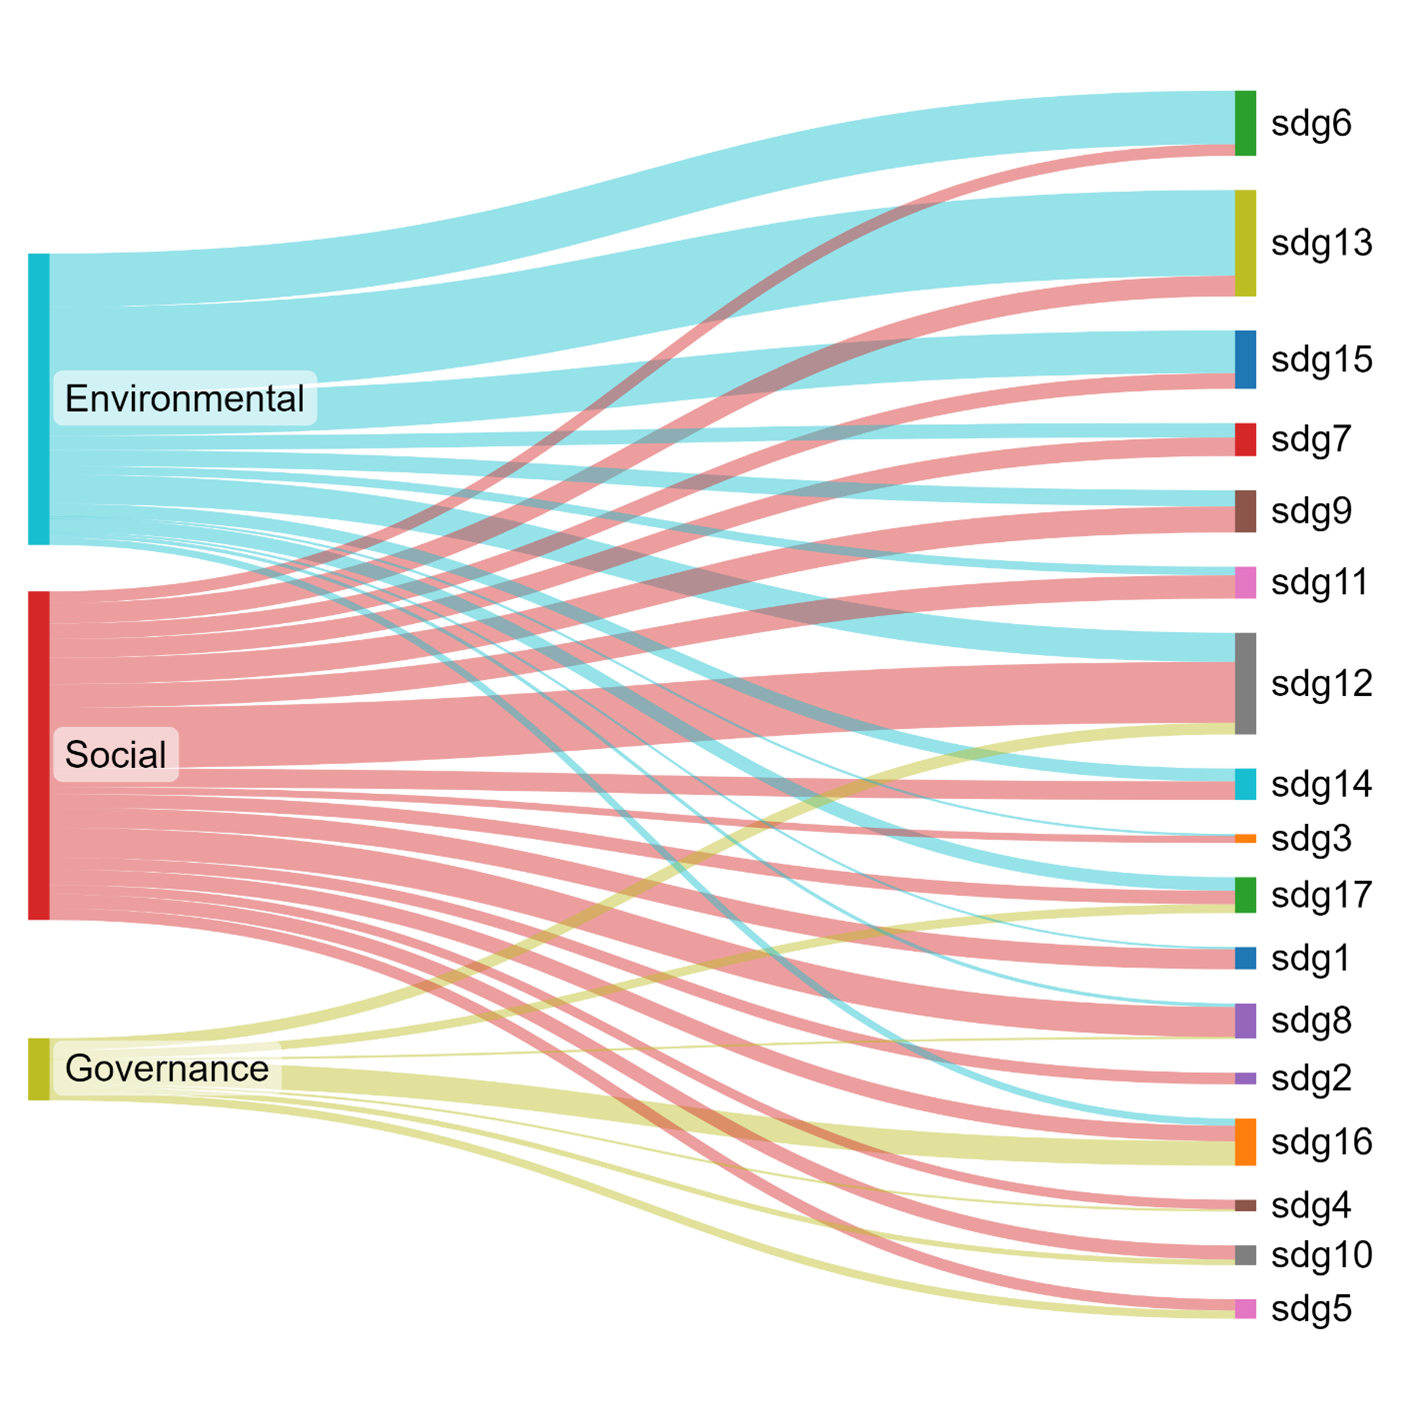
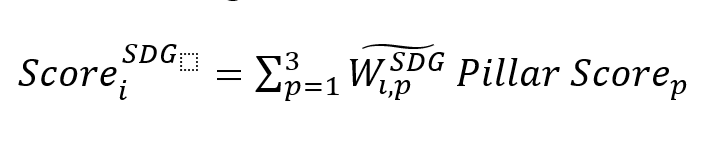
The SDG weights are used to calculate the stock specific SDG scores, using the following methodology:
We use the SDG scores to calculate SDG bivariate factor mimicking portfolios sorted on size and sdg scores, using a 90% breakpoint for the size and a [30,70] breakpoint for the sdg related signals. Figure 14 depicts the value of 1 dollar invested in the 17 factor mimicking portfolios, which proxy for risks related to the implementation of the 17 SDG goals.
Figure 14 SDG factors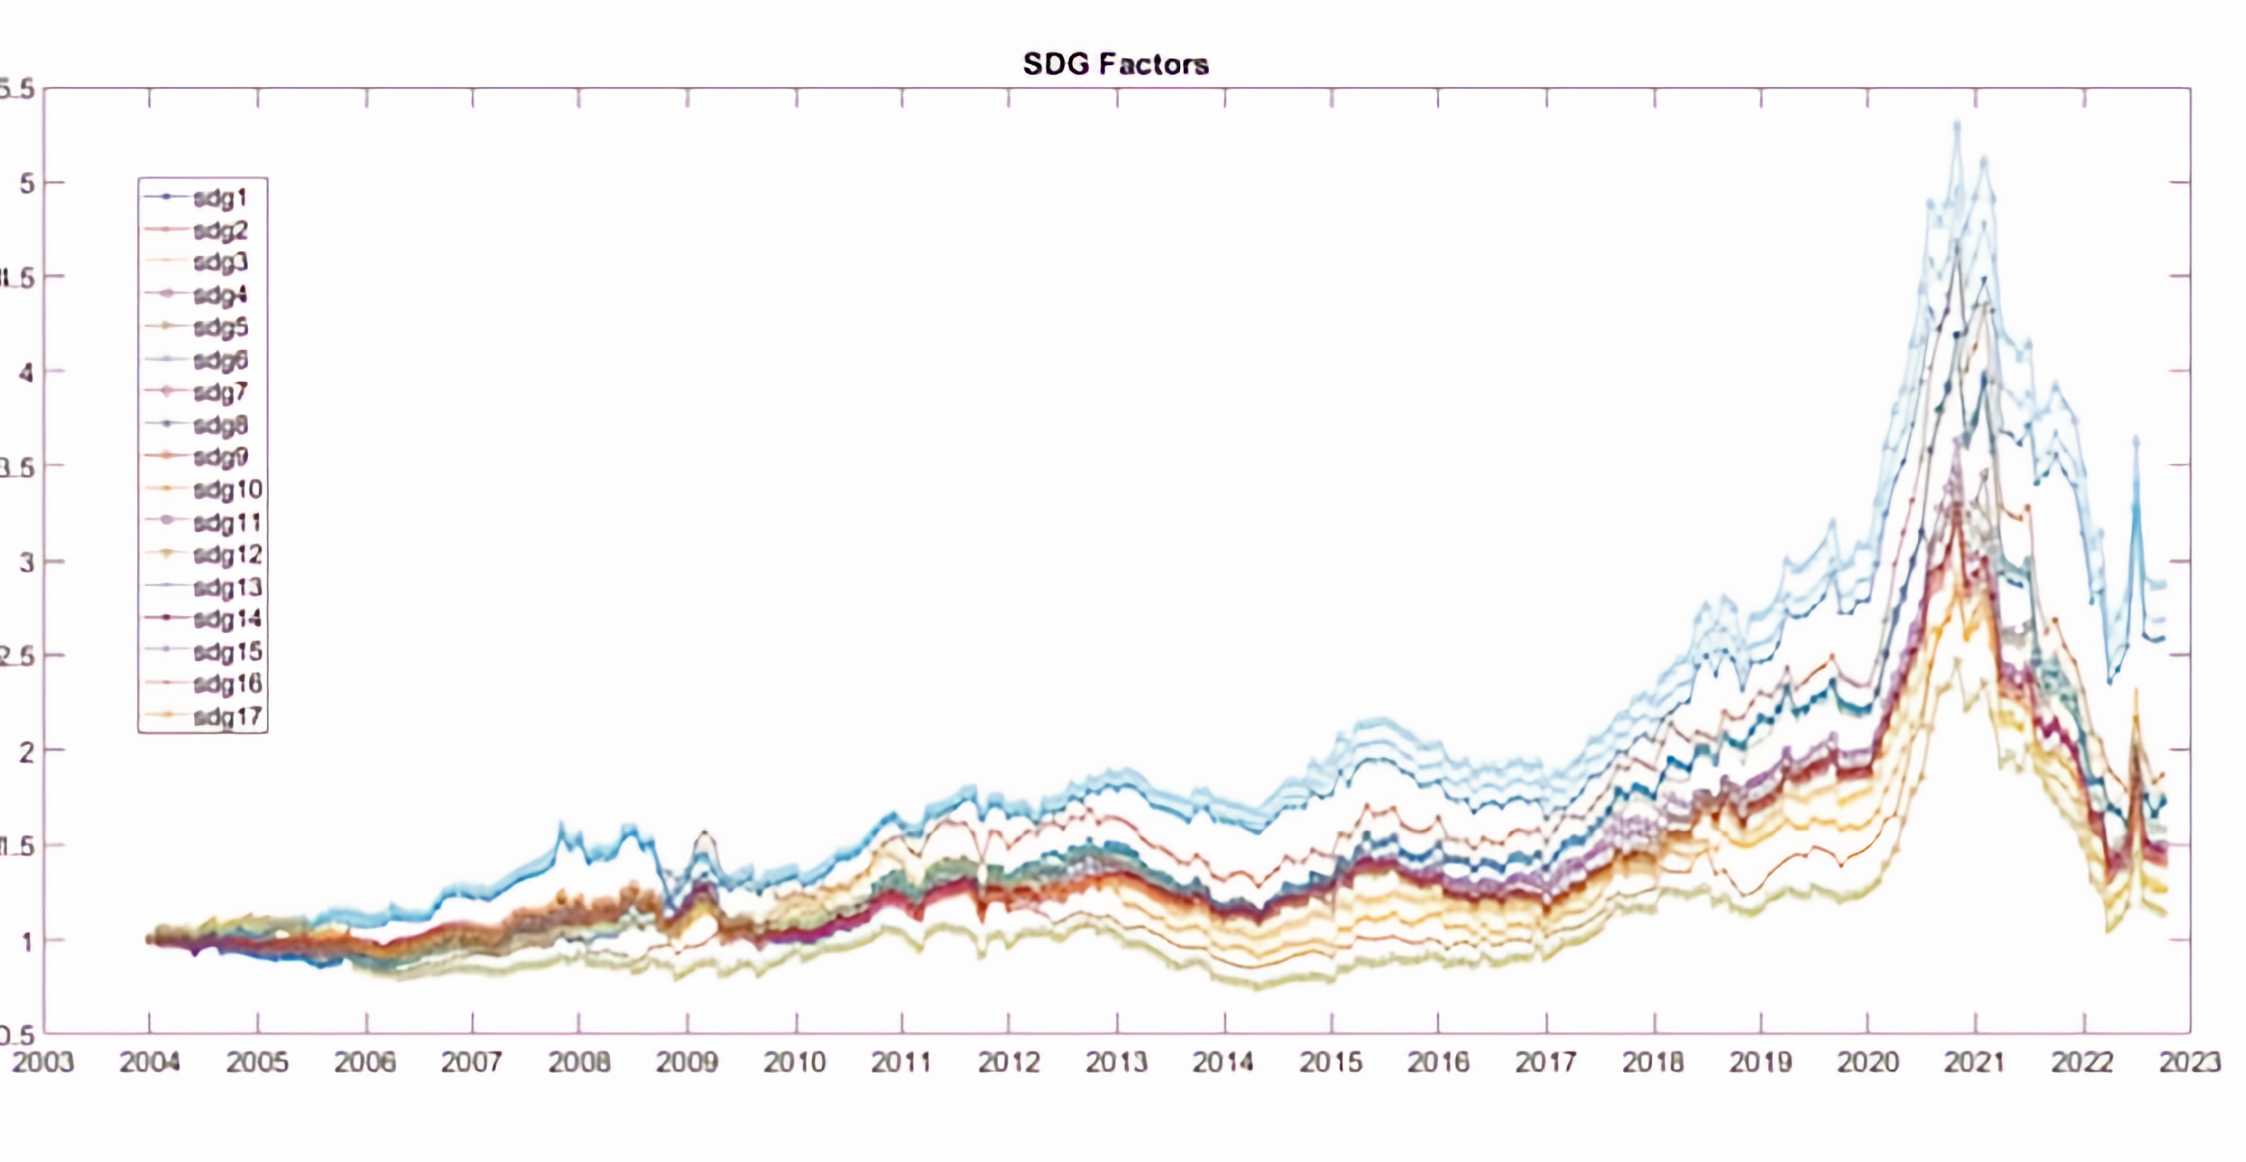
The above set up can be trivially used to calculate the SDG footprint of financial portfolios. We can use an extended version of the Fama and French 3 factor model to estimate the sensitivities of assets to the SDG related factors.

Where  , denotes a risk-free rate.
Suppose portfolio contains N shares with weights a~1~, …, a~N~ where  ,
,
SDG Footprint of portfolio relative to jth sdg factor can be calculated as the weighted sum of portfolio weights and asset’s sensitivity to factor j.
6.5 Conclusion
Our work reveals significant returns associated with recent good performance of companies relative to ESGs. We document a strong ESG Momentum in international marlets; Big stocks that increase their performance during the last 2 years seem to earn a significant premium relative to Bad performers. Moreover, a momentum in the controversies of Companies relative to ESGs is identified, which is strong to both Big and Small listed stocks.
Last but not least, we describe the process of integrating the Sustainable development goals in our asset pricing set up and the calculation of more holistic SDG factors to account for sources of priced risk related to the level of the implementation – controversies of stocks relative to the SDGs.
6.6 Chapter references
Koundouri, P., Devves, S., & Plataniotis, A. (2021). Alignment of the European Green Deal, the Sustainable Development Goals and the European Semester Process: Method and Application. Theoretical Economics Letters, 11(4), 743-770.
Koundouri, P and Landis, C. (2023). ESG and SDG Momentum in International Stock Returns, AE4RIA, UN SDSN Global Climate Hub, Athens University of Economics and Business, Working Paper.
Koundouri, P., Landis, C., & Plataniotis, A. (2023b). ESGs & SDGs Quantification and Acceleration, AE4RIA, UN SDSN Global Climate Hub, Athens University of Economics and Business, Working Paper.
Lafortune, G., Zoeteman, K., Fuller, G., Mulder, R., Dagevos, J. and Schmidt-Traub, G. (2019): The 2019 SDG Index and Dashboards Report for European Cities (prototype version). Sustainable Development Solutions Network (SDSN) and the Brabant Center for Sustainable Development (Telos).
Lafortune, G., Cortés Puch, M., Mosnier, A., Fuller, G., Diaz, M., Riccaboni, A., Kloke-Lesch, A., Zachariadis, T., Carli, E. Oger, A., (2021): Europe Sustainable Development Report 2021: Transforming the European Union to achieve the Sustainable Development Goals. SDSN, SDSN Europe and IEEP. France: Paris.
Sachs, J. D., Schmidt-Traub, G., Mazzucato, M., Messner, D., Nakicenovic, N., & Rockström, J. (2019). Six transformations to achieve the sustainable development goals. Nature sustainability, 2(9), 805-814.
Sachs J., Koundouri P. Becchetti L., Brunnhuber S., Chioatto E., Cordella M., Devves S., Halkos G., Hansmeyer C., Landis C. Morone P., Patel K., Plataniotis A., Romani I., Spani R., Stavridis C., Tessari F., Theodossiou N., Wetzel D., Zachariadis T., (2022), Financing the Transformations for the Joint Implementation of Agenda 2030 for Sustainable Development and the European Green Deal
Tensie Whelan, Ulrich Atz, Tracy Van Holt and Casey Clark, 2021, ESG and Financial Performance, NYU STERN, https://www.stern.nyu.edu/sites/default/files/assets/documents/ESG Paper Aug 2021.pdf, Assessed 20/6/2023.
Gregor Dorfleitner, Christian Kreuzer, Ralf Laschinger, 2021, How socially irresponsible are socially responsible mutual funds? A persistence analysis, Finance Research Letters, 43, https://doi.org/10.1016/j.frl.2021.101990.
Dorfleitner, G., Kreuzer, C. & Sparrer, C. ESG controversies and controversial ESG: about silent saints and small sinners. J Asset Manag 21, 393–412 (2020). https://doi.org/10.1057/s41260-020-00178-x
Gregor Dorfeitner, Christian Kreuzer, Christian Sparrer, 2021, ESG controversies and controversial ESG: about silent saints and small sinners, Journal of Asset Management (2020) 21:393–412 https://doi.org/10.1057/s41260-020-00178-x
Vasilescu, Camelia and Wisniewski, Tomasz Piotr, Rebuilding a shattered reputation: Discretionary accruals and donations following corporate controversies (April 10, 2020). Available at SSRN: https://ssrn.com/abstract=3484818 or http://dx.doi.org/10.2139/ssrn.3484818
Baz, Jamil and Granger, Nicolas and Harvey, Campbell R. and Le Roux, Nicolas and Rattray, Sandy, Dissecting Investment Strategies in the Cross Section and Time Series (December 4, 2015). Available at SSRN: https://ssrn.com/abstract=2695101 or http://dx.doi.org/10.2139/ssrn.2695101
Zoltán Nagy, Altaf Kassam, Linda-Eling Lee, 2015, Can ESG add Alpha?, The Journal of Investing, 25(2), 113-12410.3905/joi.2016.25.2.113.
Bauer, R., and Hann, D. (2010). Corporate Environmental Management and Credit Risk. ECCE Working Paper. University Maastricht, The European Centre for Corporate Engagement.
Jiao, Y. (2010). Stakeholder Welfare and Firm Value. Journal of Banking and Finance, 34, 2549-2561.
Schneider, T. E. (2011). Is Environmental Performance a Determinant of Bond Pricing? Evidence from the U.S. Pulp and Paper and Chemical Industries. Contemporary Accounting Research, 28(5), 1537-1561.
Utz, Sebastian and Wimmer, Maximilian. (2014). Are They Any Good at All? A Financial and Ethical Analysis of Socially Responsible Mutual Funds. Journal of Asset Management, 15. 10.1057/jam.2014.8.
Roy. Henriksson and Joshua Livnat and Patrick Pfeifer and Margaret Stumpp ,2019, Integrating ESG in Portfolio Construction, Journal of Portfolio Management
Footnotes
We use all stocks with ESG data coverage in Thomson Reuters Datastream (TDS). ↩︎
Total Return Index (RI datatype, see http://product.datastream.com/navigator/search.aspx.) describes the growth in value of an investment, assuming that dividends are re-invested to purchase additional units of an equity at the closing price, applicable on the ex-dividend date. Ex-date detailed dividend data are available from 1988, except USA and Canada, where they are available from 1973. The percentage change of TDS’s RI datatype is equivalent to CRSP’s return variable (daily item id ‘ret’ item, see [www.crsp.com/files/data_description_guide_0.pdf](http://www.crsp.com/files/data_description _guide_0.pdf)). ↩︎
For detailed definitions for the Thompson Reuters Refinitive ESG metrics, see: https://www.refinitiv.com/content/dam/marketing/en_us/documents/methodology/refinitiv-esg-scores-methodology.pdf ↩︎
French data library, see: http://mba.tuck.dartmouth.edu/pages/faculty/ken.french/data_library.html#International ↩︎
KOUNDOURI AND LANDIS (2023) provide an extent analysis using all Category and Pillar scores also. ↩︎
Value weighted portfolios, use the market cap on month t-1. ↩︎
We rather follow the FF methodology of Momentum factor, which is rebalanced Monthly, on contrary to Market, Size and Value factors which are rebalanced annually. ↩︎