4. Interdependence, Networks, and Green Deal: The EU's Opportunity to Redefine the Landscape of Global Sustainable Development Challenges
Authors:
Etienne Berthet, Section for Quantitative Sustainability Assessment, Technical University of Denmark (DTU), Kgs. Lyngby, Denmark
Ilaria Fusacchia, Department of Economics, Roma Tre University; Roma, Italy > Candy Anquetil-Deck, Industrial Ecology Digital Laboratory, Norwegian University of Science and Technology (NTNU), Trondheim, Norway
In the context of a global interconnected world, we are confronted with a complex system of transnational flows. These flows span a wide array of elements, including data, energy, human populations, biological entities, commodities, and physical matter. This intricate system engenders novel environmental and socio-economic challenges, carrying out significant repercussions for both the societal structures of human communities and the overall health of our planet’s ecosystems (Liu et al., 2018). The escalating interdependence of these diverse global flows has amplified cross-border environmental and socio-economic interactions, blurred geographical boundaries and produced effects that transcend local and national scopes (Liu et al., 2018) (OECD/EC-JRC, 2021) (Xu et al., 2020).
Of particular concern are the international trade-related flows, which give rise to far-reaching spillover-feedback effects (hereinafter as spillover) that bear significant implications for international governance and global frameworks such as the United Nations Framework Convention on Climate Change (UNFCCC) or the United Nations Sustainable Development Goals (SDGs) (Sachs et al., 2021) (Schmidt-Traub et al., 2019) (OECD/EC-JRC, 2021). Consequently, to effectively advance the realization of the SDGs, it is imperative to comprehensively assess the direct and indirect impacts of relevant policy measures to mitigate potential adverse consequences while simultaneously augmenting their beneficial outcomes (Liu et al., 2018) (Engström et al., 2021).
The concept of Weaponized Interdependences (WIs) has been recently formalized and refers to the strategic use of economic, financial, and technological interdependencies as instruments of power and coercion in international relations. It relies on an essential structural condition, a globalized network that creates high levels of interdependence among states (Farrell & Newman, 2019). As such, it involves states leveraging their positions within global networks, such as trade, supply chains, and financial markets, to exert influence, achieve strategic objectives, and potentially coerce other actors. This phenomenon highlights the growing importance of non-military power sources and underscores the complex and interconnected nature of the modern global landscape, where state actors may utilize these interdependencies to pursue their goals and navigate geopolitical competition.
As underlined by (Drezner et al., 2021), the dynamics associated with WIs have recently undergone a remarkable acceleration due to several factors, including the deterioration of relations between the United States of America and China, the readiness of emerging legislative powers to exert coercion, and disruptions in global supply chains amidst the COVID-19 pandemic. Farrell and Newman also point out the anticipated acceleration of these dynamics, regarding a globalization that will become increasingly politicized and the subject of more significant contestation and coercion (Drezner et al., 2021).
In essence, the obstacles presented by global sustainability and the increasing influence of WIs define the shapes of the most important geopolitical challenges of the 21st century. As our current civilizations grapple with existential threats such as biodiversity collapse or global warming, the strategic use of economic and financial interdependencies as instruments of power and coercion has emerged as a potent force in international relations. Consequently, it is crucial to scrutinize matters that necessitate global cooperation, including the SDGs, through a framework that captures the emergent forms of economic and geopolitical duress based on the nodes and networks encompassed by globalization.
The forms of coercion defined by WIs have been debated among policymakers. However, it is worth noting that those discussions have not been as prevalent within academic circles (Baker, 2013) (Drezner et al., 2021). Moreover, these discussions have yet to permeate the academic literature, specifically addressing sustainability concerns. This discrepancy can be attributed to the challenges these forms of coercion present when attempting to align them with existing frameworks and theories in the academic literature (Wright, 2017). Furthermore, this absence is also due to methodological gaps. Despite the significant influence of WIs compared to more traditional theories of international power, it shares the limitations characteristic of structural approaches. Specifically, WIs do not adequately differentiate between power, defined as the ownership of resources, and influence, characterized as the ability to utilize those resources effectively to pursue state policy objectives. However, this ability is also a form of power, as defined by Robert A. Dahl. In the “The Concept of Power”, Dahl defined power as the ability of one person (or group) to get another person (or group) to do something they otherwise would not do (Dahl, 1957). With this perspective, a nation’s threat to overutilize some resources (for instance, fossil fuels or tropical rainforests) above the thresholds defined by scientists (Welsby et al., 2021) could result in irreversible harm to humanity. Hence, it becomes imperative to decode them to employ them effectively and meaningfully.
Farrell and Newman acknowledge this methodological aspect by underlying the importance of “appropriate institutions” to distinguish between power as a possession of resources and influence as the capacity to wield those resources to achieve policy objectives (Drezner et al., 2021). Moreover, Jentleson further expounds on this concept, illustrating that countries can wield those WIs through actions beyond conventional diplomatic means. Similarly, WIs could be used for climate change mitigation or other shared global goals. Like most power manifestations, WIs are not inherently good or malign; their worth is contingent upon how they are employed by the participating entities (Jentleson, 2021), but then it is crucial to decrypt them to use them in a relevant way.
In this chapter, we do not assert that all the different SDGs should be analyzed through the reading grid of WIs, nor that their achievements require a permanent power relationship among nations. Nevertheless, we propose that some of them, particularly when the national and global interests diverge or when there are substantial transnational spillovers, must consider those relations in a framework which is not the traditional framework between economic actors nor the traditional geopolitical framework between states.
In 2021, the European Union (EU) passed the European Climate Law, thereby formally enshrining the goal outlined in the European Green Deal (European Commission, 2019) (European Commission, 2021a). The law targets net-zero greenhouse gas emissions (GHG) by 2050 for the EU’s economy and society. The scope of the European Green Deal is way broader than the GHG mitigation only, addressing various sustainability challenges. For example, its official definition emphasizes the necessity for a “cost-efficient” and “socially fair” transition to a sustainable economy. It also tackles deforestation issues, as evidenced by the European Parliament’s provisional political agreement in 2022 to ensure that a list of select agricultural and forestry products entering the EU market “will no longer contribute to deforestation and forest degradation in the EU and elsewhere in the world”.
While the EU’s efforts to operationalize, these intentions are still underway, a comprehensive understanding of the intricate interplay between the EU, other nations and diverse sustainability issues is crucial for formulating effective policies to actualize these intents and enhance international cooperation. Without this understanding, the eventual outcomes may fall short of the EU’s stated ambitions.
This chapter is structured in three sections. First, we show how recent advancements in accounting frameworks and resource economics can be utilized to accurately quantify the distinction between power as a possession and influence as the ability to leverage these resources to accomplish policy objectives. In the second section, we apply this framework to the EU’s latest unilateral initiative to combat international deforestation, specifically in Brazil, to assess this initiative’s effectiveness. Lastly, we employ this framework to examine various social impacts, exploring how this novel approach can contribute to establishing robust bases for policymaking, targeting high-impact flows of different types.
4.1. Traversing externalities and methodological gap: the Throughflow Based Accounting
The SDGs are a set of interconnected global objectives that address various economic, social, and environmental issues. Some of the main challenges to achieving them require a better understanding of the externalities generated by human activities, as it is necessary to minimize the negative externalities (such as air pollution or eutrophication) and maximize the positive ones (such as employment or gender equality) (United Nations: New York, NY, 2015). Furthermore, it is also necessary to precisely delineate their spillover-feedback effects (hereinafter as spillover) between countries, as one country’s success for one particular SDG may jeopardize the success of another SDG in another country.
As mentioned in the introduction, the novelty of the approach presented here is to analyze some of those challenges within the WI framework. It is worth reminding that not all the SDGs need to be scrutinized in the context of WI. Some urgent existential threats may drive states to cooperate more closely, fostering a spirit of multilateralism and interdependence. However, pursuing strategic advantage through economic and financial levers can exacerbate existing inequalities, erode trust between nations, and hinder the collective action needed to address those existential threats. Regarding this second option, it is crucial to understand what is (and what is not) included in the WI framework. Figure 1 (which was directly taken and modified from (Drezner et al., 2021) summarizes the various channels and targets related to the nature of WI.

Figure 1 This figure is directly taken and adapted from (Drezner et al., 2021). It provides an overview of the varieties of economic coercions and classifies them, indicating the target of coercion and the channel used to apply this pressure.
The WI framework offers a useful lens for analyzing the complex nature of the Sustainable Development Goals (SDGs). However, addressing these interconnected goals necessitates a thorough understanding of the structural geography and network topology that underpin our globalized world. As Drezner et al. (2021) note, “The image of globalization as global competition, an increasingly flat world in which everyone plays on the same level playing field, is seductive but dangerously misleading. Networks have their own geographies, which are the consequence of physical geography, investment decisions, and the strategic deployment of state power.”
In today’s interconnected world, long and intricate international production processes characterize global trade (Xiao et al., 2020). Commodities typically undergo numerous transformation steps involving various industries, many of which are located in different countries (Beaufils et al., 2023). This complexity obscures contributions to joint production efforts and dilutes responsibilities for generating externalities (Kagawa et al., 2015; T. Wiedmann & Lenzen, 2018). Therefore, the topology of the globalization must be delineated to untangle the flows of commodities between countries as well as their environmental and social impacts expressed in the SDG framework. Such impact identification is required to reconsider the use of network rather than bilateral market access and ultimately switch from traditional place-based governance to a more holistic flow-based approach (Xu et al., 2020).
However, methodological gaps have impeded the development of an efficient flow-based approach that captures the full scope of externalities embodied in trade flows. Traditional accounting methods, for instance, do not retain information about flow-transitioning countries (Wood et al., 2019). Hence, a robust framework to assign responsibility for internationally traded externalities was still missing by tracking and managing where the key flows start, progress and end (Tian et al., 2022).
This chapter operationalizes a systemic method for quantifying the social and environmental impacts directly and indirectly associated with consumption within a country’s territorial boundaries but produced elsewhere. We employ the Throughflow Based Accounting (TBA) framework (Beaufils et al., 2023) to identify the externalities embodied in imports/exports directly traded between countries as well as those traded through intermediate countries (cf. Figure 2). By translating these findings into the SDGs framework, we can assess the impacts generated by international trade flows more comprehensively, considering producers, consumers, and other relevant partners. This approach lays a solid foundation for addressing the complex challenges of the SDGs in an increasingly globalized and interconnected world.
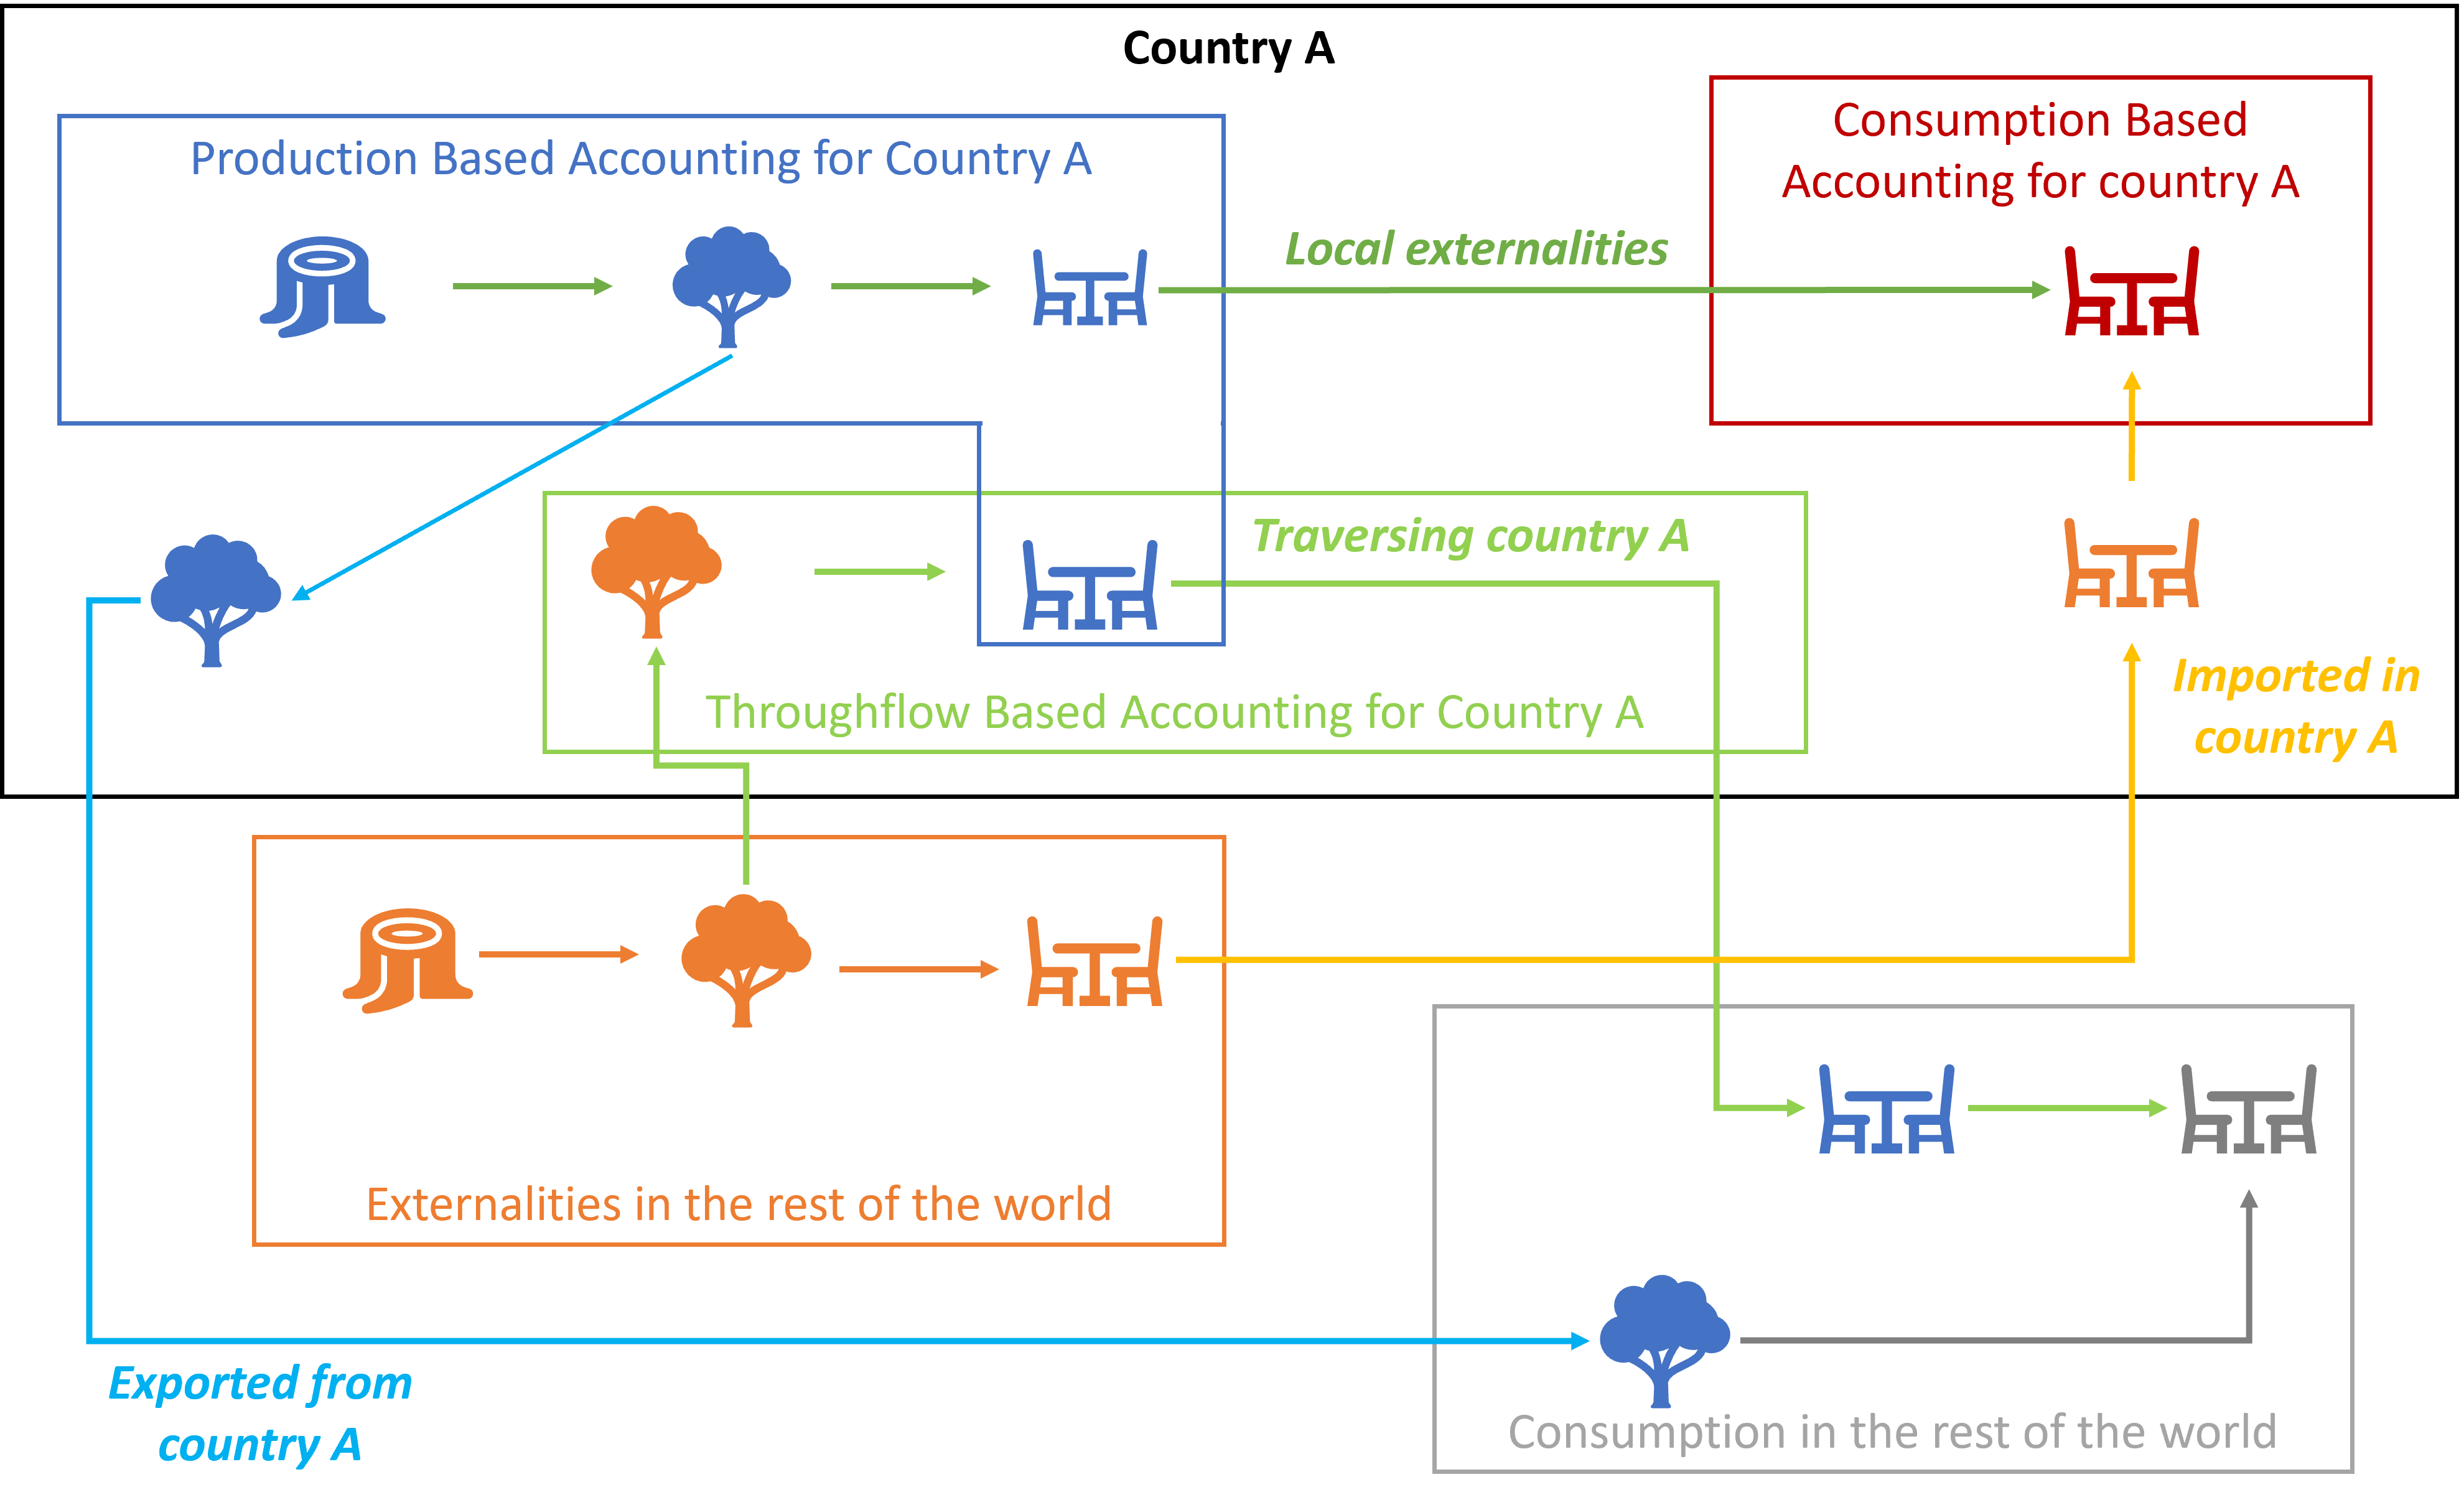
Figure 2 This figure is directly taken and adapted from (Beaufils et al., 2023). It summarizes the concept of Throughflow Based Accounting compared to Production Based Accounting and Consumption Based Accounting, showing the externalities embodied in trade flows for a given country.
The rest of the chapter will demonstrate, using two different examples that the market power, in a bilateral use of economic interdependences for economic purposes, efficiently controls some of the negative spillovers generated by a given consumption and located in another country. However, we will also highlight the limitations of this approach and argue that employing a network-based strategy, focusing on points of control instead of relying solely on bilateral market access driven by political rather than commercial targets, may offer a more efficient means to mitigate these spillovers.
4.2. Can a unilateral initiative deal with a global issue? The example of the EU provisional political agreement on the deforestation
Deforestation remains a critical environmental concern, with considerable implications for biodiversity loss and anthropogenic greenhouse gas emissions (GHGs). Forests across the globe are under significant pressure, with geographical patterns of deforestation varying significantly. Despite evidence of forest regrowth and regeneration in Europe, Eurasia, and North America, certain regions, notably the Amazon and other tropical zones, are dealing with persistent or rapidly increasing deforestation rates (Henders et al., 2015; Hoang & Kanemoto, 2021; Pendrill et al., 2019, 2022; Winkler et al., 2021).
The agriculture and forestry sectors are intricately connected, both critical for achieving sustainable agrifood systems, sustainable development, and food security. Between 2000 and 2018, nearly 90% of global deforestation was caused by agricultural expansion, disrupting vital ecosystem services such as carbon sequestration and biodiversity (DeValue et al., 2022). In this context, the role of trade cannot be understated. Since 1995, the volume of global agricultural exports has more than doubled, significantly impacting these trends (WTO, 2019).
The responsibility to tackle tropical deforestation lies with both producing and consuming countries. Numerous studies have quantified forest degradation with international demand for agricultural and forestry products (Henders et al., 2015; Hoang & Kanemoto, 2021) (Karstensen et al., 2013) (Pendrill et al., 2022). High-income and some middle-income nations, including China and India, have witnessed net domestic forest expansion while contributing to deforestation abroad. Pendrill et al. (2019) disclosed that until 2014, the EU held the most significant deforestation footprint connected to imported agricultural commodities.
Political initiatives to combat deforestation on a large scale have mainly been stagnant until recently. Key initiatives worth noting include the Forest and Climate Leaders Partnership formed during COP 27, building on the momentum from COP 26. Furthermore, the recent push by Brazilian president Lula for an “OPEC for forests” aimed at stronger cooperation between Brazil, the Democratic Republic of the Congo, and Indonesia to establish demands from the international community for forest protection is a significant step forward. These initiatives are crucial in addressing deforestation. However, it is essential to note that they mainly come from producing countries, while the initiatives from consuming countries have remained limited, considering the high stakes involved.
However, a key development occurred in 2022 in the context of the European Green Deal, when the European Parliament reached a provisional political agreement, ensuring that a list of selected agricultural and forestry goods entering the EU market “will no longer contribute to deforestation and forest degradation in the EU and elsewhere in the world”. The EU proposal emphasizes European operators’ responsibility by broadening the scope of existing due diligence requirements and guaranteeing that the risk associated with non-compliant commodities or products imported or exported within the EU market is minimal (Council of the European Union, 2022). From the SDG perspective, this EU initiative is expected to positively impact Brazil’s progress towards SDG 15.2 – “End Deforestation and Restore Degraded Forests”.
4.2.1. The Interplay between Unilateral Actions, Global Benefits, and Country-Specific Costs
This EU provisional proposal exemplifies a unilateral market power initiative to fight against forestland use for agricultural production by conditioning EU market access on compliance with standards regulating legal deforestation. Assessing the potential implications of this proposal involves quantifying the extent of agricultural-induced deforestation attributed to the targeted commodities associated with global supply chains both terminating and intersecting within the EU.
To conduct this assessment, we built a map illustrating agricultural-driven deforestation embodied in international trade. Brazil was chosen as a case study due to its significant contribution in deforestation (Pendrill et al., 2019, 2022). Our analysis considers inter-country and inter-sector linkages (Stadler et al., 2018a) based on the most accurate spatial resolution of land use (Winkler et al., 2021) and employs the TBA (Beaufils et al., 2023) to trace deforestation embodied in international trade flows across the global economy, with an emphasis on the EU region. Our analysis focuses on the following economic sectors outlined in the provisional agreement: rice, wheat, corn and other cereals, vegetables, fruits and nuts, oil seeds, sugar crops, fiber crops, grains, other crops, and cattle.
4.2.2. Methodological Approach for Assessing Brazilian Deforestation Commodities Linked to the EU
Multi-Regional Input Output (MRIO) tables are widely used to identify direct and indirect externalities in supplying commodities to end-users (Miller & Blair, 2009; T. Wiedmann & Lenzen, 2018; T. O. Wiedmann et al., 2015; Wood et al., 2018). In line with this literature, we use data on inter-country inter-sector linkages based on the MRIO EXIOBASE (Stadler et al., 2018b).
To delineate specifically the agriculture-driven deforestation embodied in international trade, we used the HIstoric Land Dynamics Assessment+ (HILDA+) global dataset (Winkler et al., 2021) as it is one of the most recent and accurate datasets quantifying the global dynamic of change in land use. We focused on Brazil’s geographical territory from 2012 to 2019 to avoid potential biases from the 2008-2009 global financial crisis. Following the worldwide methodology exposed in (Fusacchia et al., 2022) (Berthet, Fusacchia, et al., 2023), we extend the EXIOBASE dataset with the HILDA+ data previously scoped to calculate the agriculture-driven deforestation embodied in international trade originating from Brazil. To do this, we utilized the Food and Agriculture Organization of the United Nations (FAO) data to allocate calculated deforestation to corresponding EXIOBASE economic sectors. The detailed methodology is described in the articles mentioned above. Nevertheless, the mapping table between HILDA+, EXIOBASE and FAO data (Fusacchia et al., 2022) can be found in the appendix A, Table 18.
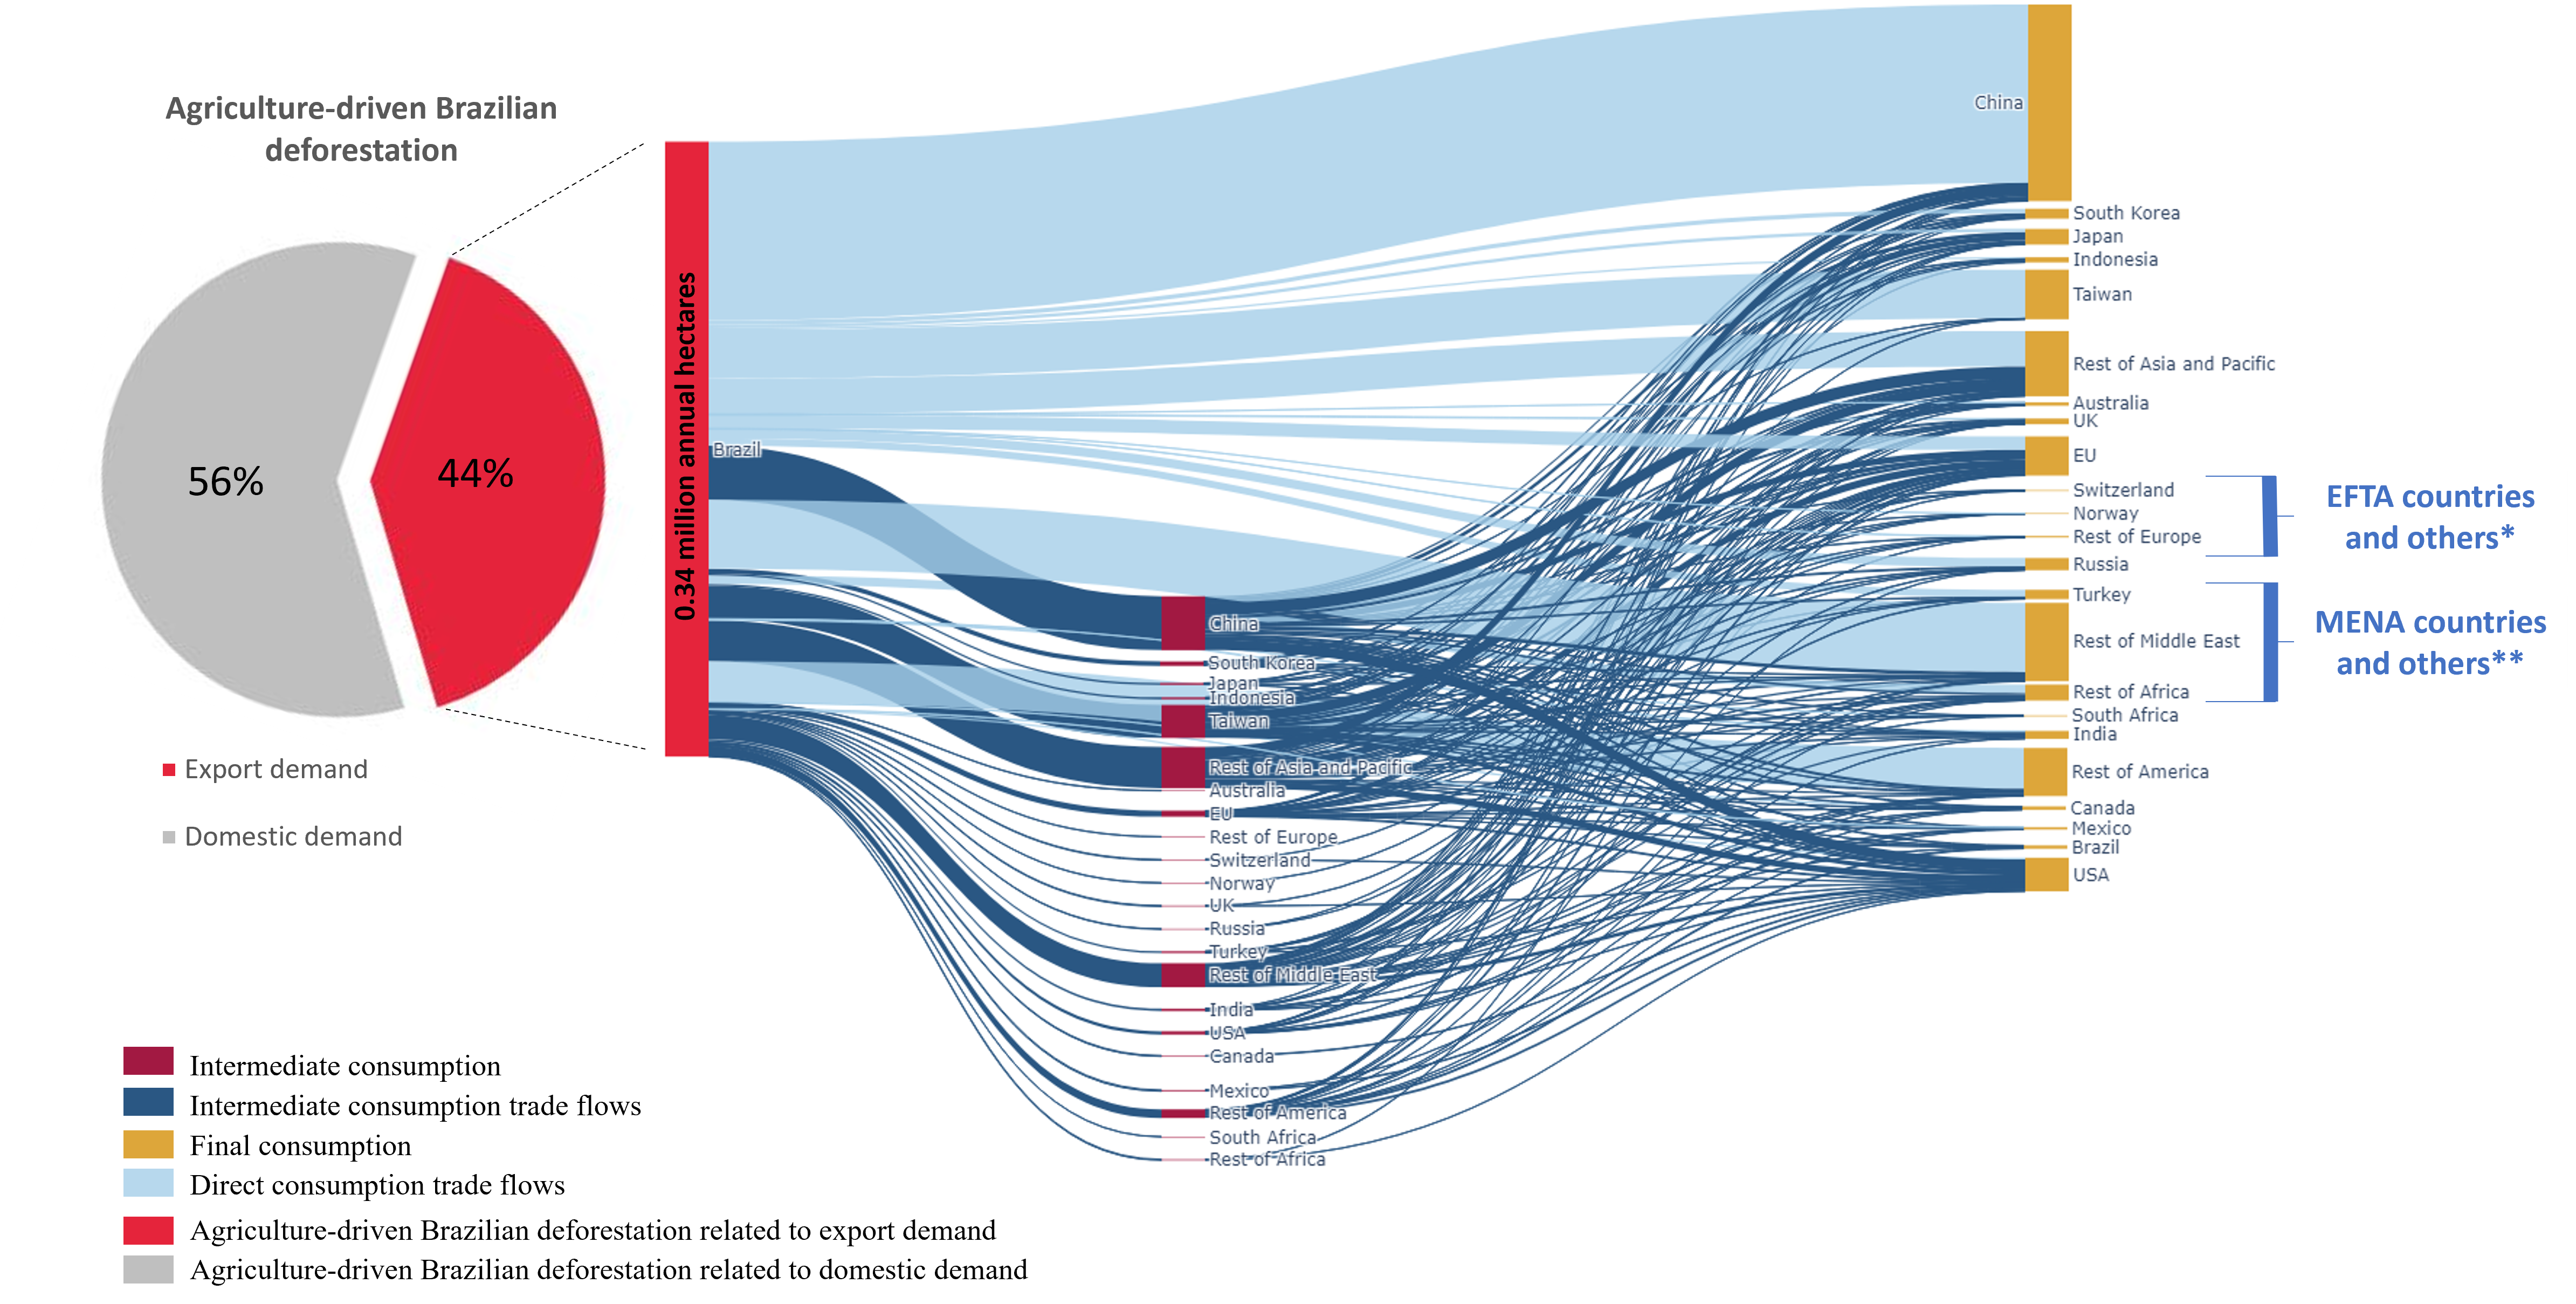
Lastly, we used the TBA (Beaufils et al., 2023) to comprehensively quantify the agriculture-driven Brazilian deforestation embodied in international trade passing through or ending in each country/area defined in EXIOBASE. We then calculate the direct consumption (commodities exported from Brazil to a given country and then consumed in this given country) and the indirect consumption (commodities exported from Brazil to a given country, then transformed and re-exported in a third country where they are finally consumed) at the country level (cf. Figure 3).
A
B
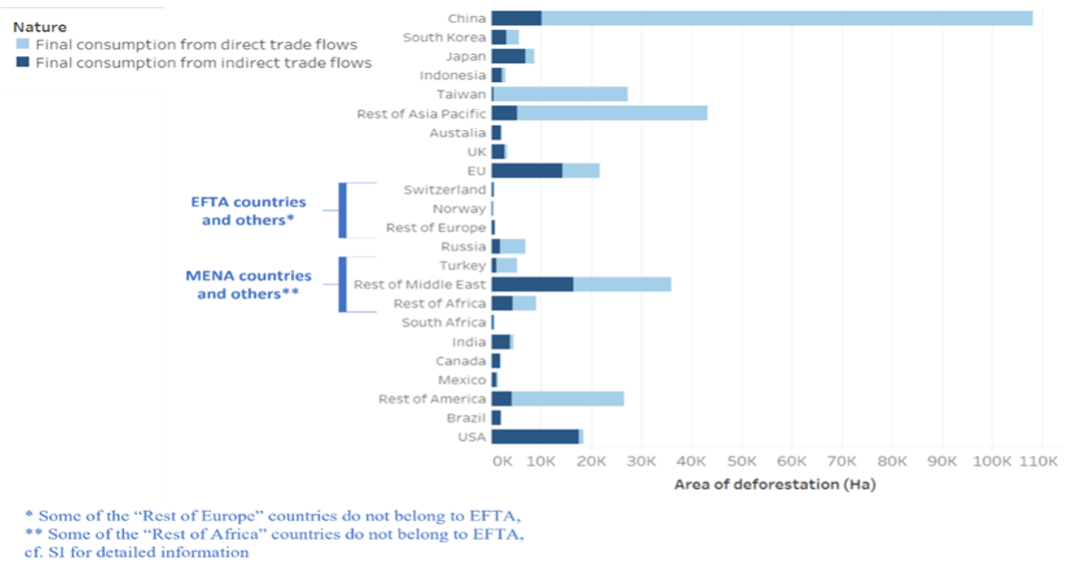
Figure 3 International trade flows embodying agriculture-driven Brazilian deforestation, detailed by their traversing area and their area of final consumption. In light blue, the upper panel (A) represents the direct consumption (commodities exported from Brazil to a given country and then consumed in this given country). In dark blue, the indirect consumption (commodities exported from Brazil to a given country, then transformed and re-exported in a third country where they are finally consumed). The size of the flows is proportional to the embodied agriculture-driven deforestation. The bottom panel (B) details the different flows from panel A by area of consumption in hectares (Ha) of agriculture-driven Brazilian deforestation.
4.2.3. The Scope of the EU’s New Deforestation Proposal and its Limitations
Our results, illustrated in Figure 3, reveal an annual Brazilian deforestation rate of nearly 0.8 million hectares driven by agriculture. During the assessment period, almost 44% of this deforestation is attributed to the production of agricultural goods consumed outside Brazil, thus embodied in trade. Our results are consistent with a recent comprehensive study on tropical deforestation driven by agriculture (Pendrill et al., 2022).
Globally, direct consumption accounts for 87% of the deforestation embodied in trade, leaving a minor role (13%) in indirect consumption. However, substantial disparities occur among countries. For the EU, 66% of the consumption is indirect, indicating that more than half of the Brazilian agricultural commodities causing deforestation during their production and finally consumed in the EU have been transformed and re-exported from a third country before their final consumption.
Looking at supply chains traversing the EU, the primary downstream flows involve the USA, the UK, and China. The EU’s role in China and the USA’s indirect consumption is minor (3.8% and 3.3%, respectively), yet more substantial for the UK (18.6%). Therefore, any trade restriction stemming from the EU’s provisional political agreement would have a minor effect on EU-China and EU-USA trade but a more considerable influence on the EU-UK relationship. Furthermore, the EU plays a significant role in the indirect consumption of EFTA countries, advocating for expanded geographical coverage of this EU provisional agreement related to the Green Deal.
The upcoming implementation of the EU’s provisional political agreement will hinge critically on the final scope of due diligence requirements, potentially covering 2.4% to 7.7% of annual trade-embodied, agriculture-driven Brazilian deforestation. This percentage depends on whether the agreement targets only direct consumption or includes indirect consumption and whether its coverage is limited to the EU or extends to the EFTA and the UK. This represents between 0.95% and 3.4% of the yearly agriculture-driven Brazilian deforestation.
While we have not assessed the exact impact of such a decrease on Brazil’s SDG 15.2 in a normalized and standardized SDG scale (as such exercise relies on several parameters and assumptions), we can notice that the score of Brazil in the 2021 Global Common Stewardship Index (GCSI) (Commons & Index, 2021) on the indicator “Permanent deforestation” is 12.6 points on 100 (100 representing the best score possible and the lowest impact) it appears that with a decrease between 0.95% and 3.4% of the annual deforestation caused by agriculture in Brazil, the EU proposal would not have a significant effect on this GCSI indicator score for Brazil. Thus, while the EU provisional agreement on deforestation sends a solid political message highlighting the need to address global deforestation, our results emphasize that without proactive engagement from other major consumer markets, the agreement may have only a marginal effect on reducing Brazilian deforestation.
4.2.4. Transitioning from a Unilateral Economic approach to Multilateral Political Strategies
Based on the previous results, we can see that the EU’s autonomous unilateral initiative may have only a minimal influence on deforestation in Brazil. To overcome this issue, and as expressed in the introduction, the context of the WI framework suggests an alternative approach wherein the EU could harness its diplomatic network rather than solely leveraging market access.
Forests and biodiversity hotspots are predominantly located in low- and middle-income countries. Convincing these nations to accept trade restrictions related to forestland presents a significant challenge, as these countries perceive such limitations as a direct limitation to their economic growth. The EU has previously encountered similar challenges in the case of the Carbon Border Adjustment Mechanism (CBAM), and numerous studies (Lowe, 2021; Perdana & Vielle, 2022; Szulecki et al., 2022) underscore the necessity of international cooperation to mitigate the potential negative impacts for lower-income countries.
However, it is essential to note that effective international collaboration does not need to be overly broad in order to produce significant results. A multilateral analysis approach based on such trade flows identification (Fusacchia et al., 2022) reveals that a European trade policy on deforestation, coordinated with only a few key partners (such as the UK and EFTA countries), could lead to a more substantial reduction in Brazilian deforestation caused by agriculture, estimated at 15.5%. This is a significant improvement compared to the modest 0.95% to 3.4% achievable through unilateral measures. Furthermore, this multilateral analysis also reveals that with an appropriate channel of the funds related to this European trade policy to increase the Brazilian agricultural total factor productivity. It would be enough to counterbalance the negative economic impact of the trade costs considered, creating a win-win scenario, increasing Brazilian GDP and decreasing deforestation at the same time.
Another strategy to leverage the network involves pinpointing strategic “chokepoints” within the international trade flows contributing to deforestation. As illustrated in Figure 3, Taiwan and MENA countries emerge as particularly relevant in this context. This perspective could enable the EU to align its geostrategic objectives with these specific deforestation spillovers, potentially positively impacting Brazil’s SDGs and global deforestation efforts.
4.3. Addressing Social Issues in the Context of the Sustainable Development Goals
The operationalization of some SDGs is contingent upon the proficient mobilization of resources to achieve defined state policy objectives, which involve unravelling the architecture of intricate networks interconnected through diverse externalities. As indicated earlier, one of the most critical methodological lacunae often pertains to the network structure. Nevertheless, once the structure is determined, integrating and quantifying the target externalities going through this network is relatively straightforward (as we presented above with the deforestation externalities from HILDA+).
However, in some cases, this step also constitutes a substantial challenge that warrants resolution. This particularly applies to externalities associated with social impacts, which are frequently linked to economic and ecological dimensions but remain insufficiently documented in available databases. A critical analysis of the prevailing models dealing with the different sustainability topics (hereafter mentioned as bioeconomic models) (Verkerk et al., 2021) unearths a conspicuous deficiency in the representation of SDGs related to social issues. In this context, SDG1 (end poverty), SDG3 (ensure health and well-being), SDG4 (provide quality education), SDG5 (achieve gender equality), SDG8 (decent work and economic growth), SDG10 (reduce inequalities), SDG11 (build sustainable cities and communities), and SDG16 (promote peace, justice, and strong institutions) command further attention. Those SDGs underscore distributional disparities among diverse societal strata and households and are either underrepresented or neglected (Verkerk et al., 2021).
Given this deficit, there is a compelling need to enhance the sophistication and breadth of social indicators. A viable strategy to address this concern involves the integration of indicators based on distributional data and econometric analyses. This approach delineates a pathway towards a more holistic representation of social goals and indicators. In addition, fostering links with existing social models presents another potential method for improving the current bioeconomic models. The implementation of these strategies can engender a more robust and inclusive modeling framework that sufficiently integrates these crucial social SDGs (Verkerk et al., 2021). These endeavors necessitate substantial work within the research agenda of this subject and extend beyond the scope of this present chapter. Nevertheless, an alternative solution to forge connections with social models while bypassing those challenges is to develop solutions thanks to MRIOs.
The use of MRIOs for footprint calculation is not limited to the environmental footprints of countries but can also be used for social footprints through Social Life Cycle Assessment (SLCA) methodology (C. B. Norris et al., 2013; C. Norris & Norris, 2015). SLCA has emerged as a valuable tool for assessing the social and economic impacts associated with geographic locations and stakeholder categories along the life cycle of products. Despite its widespread application and methodological guidelines established in 2009 (Walsh, 2006), the methodology is still in its early stage (Mancini & Sala, 2018). One of the most significant remaining challenges in combining MRIO and SLCA approaches is the accuracy of social data, particularly regarding low-income counties.
In alignment with the foundational goal of the EU Green Deal to promote a “socially fair” shift towards a sustainable economy, this section explores the social implications associated with the EU’s consumption patterns. This exploration becomes crucial to formulating further EU Green Deal proposals, considering environmental and social aspects. SDG 8, which promotes decent work and economic growth, provides an effective framework for this analysis. We focus particularly on indicator 8.8.1, which addresses the frequency of fatal and non-fatal work-related injuries segmented by gender and migrant status. This comprehensive assessment could provide a deeper understanding of the broader socio-economic impacts of the EU’s consumption and, thus, guide a more socially fair and inclusive transition under the EU Green Deal.
4.3.1. Methodological Considerations
Ensuring social data’s reliability is essential in accurately evaluating social and economic impacts across geographical locations, economic sectors and stakeholder categories. Yet, the MRIO model utilized in our research (EXIOBASE) was hindered by out-of-date or significantly proxy fatality statistics, causing potential inaccuracies in our findings. We have comprehensively revised EXIOBASE fatality data to address this shortcoming, incorporating detailed, nation-specific, and up-to-date data. The update includes work-related fatal occupational injuries as well as fatalities associated with occupational exposure to a variety of 18 hazardous substances and conditions such as asbestos, arsenic, benzene, beryllium, cadmium, chromium, diesel engine exhaust, formaldehyde, nickel, polycyclic aromatic hydrocarbons, silica, sulfuric acid, trichloroethylene, asthmagens, particulate matter, gases and fumes, noise, ergonomic factors, and prolonged working hours. Our methodological process is built on three pillars: data acquisition, raw data processing, and computation of fatal injuries by country, gender, year, and EXIOBASE economic sector.
Data were sourced from the World Health Organization (WHO) (Pega et al., 2021) and Eurostat databases (Publications Office of the European Union, 2013). The WHO data was carefully screened based on specific criteria such as age above 15 years, gender, and fatal injuries only. Eurostat data provided granular information on work-related fatalities, classified by economic activities in the European Community (or NACE Rev.2 (Eurostat, 2008)). The WHO provided aggregate fatality data for 2010 and 2016. The strategy for allocating these deaths across Eurostat categories depended on the countries’ geographical location, with different methods applied to European and non-European nations.
For European nations, fluctuations in fatality numbers within a NACE Rev.2 sector mirrored the changes registered by Eurostat. For non-European countries, fatality figures were proportionally allocated across economic sectors split according to the NACE Rev.2 classification, reflecting the workforce size associated with each economic sector. Due to the scarcity of data for nations within Asia, America, or Africa, we adopted a regional approach, computing fatality ratios over each NACE Rev.2 category for each region by integrating data for available countries over a reference year. For 2010 and 2016, the aggregate fatality figures for nations within these three zones were established. Due to the temporal proximity of both reference years, we postulated a linear trend in the fatality count between these two years. The number of fatalities for a specific country, year, and per NACE Rev.2 activity was then calculated by applying the previously mentioned fatality ratio to the total number of deaths for that nation. Last, we applied the European annual ratios to their total mortality figures for the few countries that could not be classified as European or belonging to one of the aforementioned zones.
The result is a comprehensive database that includes the number of fatalities (expressed in the number of deaths for work-related fatal occupational injuries and in Disability-adjusted life years (DALYs), for fatalities associated with occupational exposure to a specific risk factor), detailed at the country, gender, and NACE Rev.2 sector levels from 2008 to 2019, providing insights into work-related fatal injuries across different health effects and geographical regions. The entire database is readily available in the Supplementary Information (SI).
4.3.2. The social impacts of the supply chains traversing the EU are not neglectable
Figure 4.A delineates the work-related fatal occupational injuries linked to goods consumed within the EU (referred to in the figure as Consumption-Based Accounting Framework, or CBA) as well as goods within supply chains traversing the EU (referred in the figure as Throughflow-Based Accounting Framework, or TBA). The occupational fatalities associated with EU consumption are significant, with the annual toll exceeding 10,000 individuals. This means that over 10,000 workers perish annually in producing goods outside the EU that are ultimately consumed within the EU, contributing to the affective well-being of its citizens (Iyer & Muncy, 2016). Although not as pronounced, fatal occupational injuries embodied within EU supply chains are significant, accounting for approximately 20% of work-related fatalities connected to EU consumption, as visualized in Figure 4.C. The leading causes of those work-related fatal occupational injuries are road injuries, falls, and drowning.
Figure 4.B, mirroring the flows and framework of Figure 4.A, reflects the DALYs from three occupational exposures: asbestos, asthmagen, and chromium. Asbestos and asthmagen carry the heaviest burden among the occupational exposures analyzed, linked respectively to approximately 100,000 and 80,000 annual DALYs outside of the EU and associated with EU consumption. The DALYs from these exposures, similar to occupational fatalities, are substantial within supply chains traversing the EU, accounting for about 20% of the total of the DALYs linked to EU consumption, as shown in Figure 4.C. The sectors contributing to these occupational fatalities primarily include construction, transport, manufacturing, and agriculture.
When we focus more particularly on asbestos and asthmagen, the gender gap is particularly significant for both. This is mainly since the economic sectors affected by those exposures are also confronted with important gender gaps in their sociology. Indeed, occupational exposure to asbestos during inhaling asbestos fibres in the workplace (World Health Organization, 2006). As such, workers in the mining, construction and civil engineering, agriculture, automotive, thermal, and other insulation, boat building, ship-breaking and mechanics industrial sectors are at risk of occupational asbestos exposure. Those sectors have a gender gap in favour of men. The link between exposure to asbestos and the related DALYs is established via several cancers, mainly related to lung cancer, ovary cancer, larynx cancer and mesothelioma (Pega et al., 2021).
These fatality figures are not inevitable. Ratifying and implementing measures such as the ILO Promotional Framework for Occupational Safety and Health Convention, 2006 (No. 187) (International Labour Organization, 2006), and Occupational Safety and Health Convention, 1981 (No. 155) (International Labour Organization, 1981), could significantly reduce work-related fatalities. Concerning asbestos, eliminating its use in workplaces can mitigate the associated disease burden. Steps towards this goal include incorporating protective measures in national occupational health and safety programs and comprehensive management of existing asbestos. Implementing specific workplace controls, such as engineering and administrative controls and personal protective equipment, can significantly reduce exposure risks (Pega et al., 2021).
Our analysis underlines that the social consequences associated with EU consumption or trade are significant. It suggests that even when direct intervention in imports may be challenging due to political, economic, or geopolitical constraints, strategic improvements in supply chain management could substantially decrease work-related fatalities tied to the production of goods crossing EU borders. This observation amplifies the demand for strategic policy and practical interventions by the EU to safeguard lives within the sustainability framework. A paradoxical situation could arise if the number of fatalities increases in specific sectors due to the implementation of the EU Green Deal proposals while one of the original requirements of the Green Deal is to be “socially fair”. For instance, the energy transition in the EU could inadvertently escalate fatalities in mining regions linked to the required extraction of critical raw materials. As such, it’s pivotal for the EU to ensure that the efforts towards sustainable development and Green Deal initiatives do not exacerbate the already complex issue of work-related fatalities.
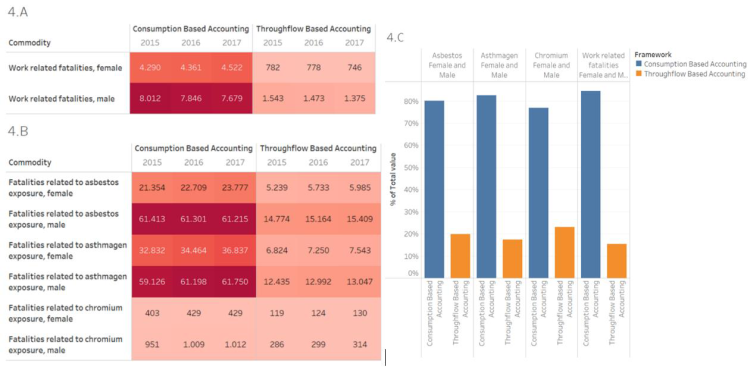
Figure 4 On the top-right panel (Figure 4.A), the number of work-related fatal occupational injuries related goods consumed within the EU as per the Consumption-Based Accounting (CBA) framework, as well as goods within supply chains traversing the EU, as per the Throughflow-Based Accounting (TBA) framework. Results are expressed in the number of fatalities. On the bottom-left panel (Figure 4.B), the number of DALYs related to asbestos, asthmagen and chromium related to occupational fatalities linked to goods consumed within Europe as per the CBA framework, as well as goods within supply chains traversing the EU, as per the TBA framework. On the right panel (Figure 4.C), for each commodity presented in Figure 4.A and Figure 4.B, the proportions detailed per type of framework (TBA vs CBA).
4.3.3. Balancing EU’s Social Concerns with Downstream and Upstream Effects
Examining supply chains traversing the EU extends beyond their analysis and into the precise identification of countries positioned in their upstream or downstream parts. Figure 5 illustrates a comprehensive perspective of different flows for two commodities, asthmagen and asbestos, traversing the EU (Figure 4.B).
The predominant upstream flows for asthmagen are rooted in Asia and Africa. In contrast, for asbestos, these flows mainly stem from the UK, Russia, and European countries outside the EU. We deliberately excluded intra-EU trade from our analysis to prevent skewing the data. Both commodities demonstrate the USA and China as the two primary consumers.
This level of detailed delineation is instrumental in pinpointing potential allies, partners, opponents, or detractors. It aids in rallying a group of countries for participation in an initiative yielding mutual benefits and identifying strategic leverage points within the supply chain, be they downstream or upstream. The precision of these maps directly empowers policymakers, enabling them to target and devise strategies mitigating specific indirect impacts accurately.
Thus, comprehensive and accurate mapping is critical for policy development and strategic planning. It will equip the EU with the ability to target its efforts effectively, focusing on relevant SDGs and specific countries.
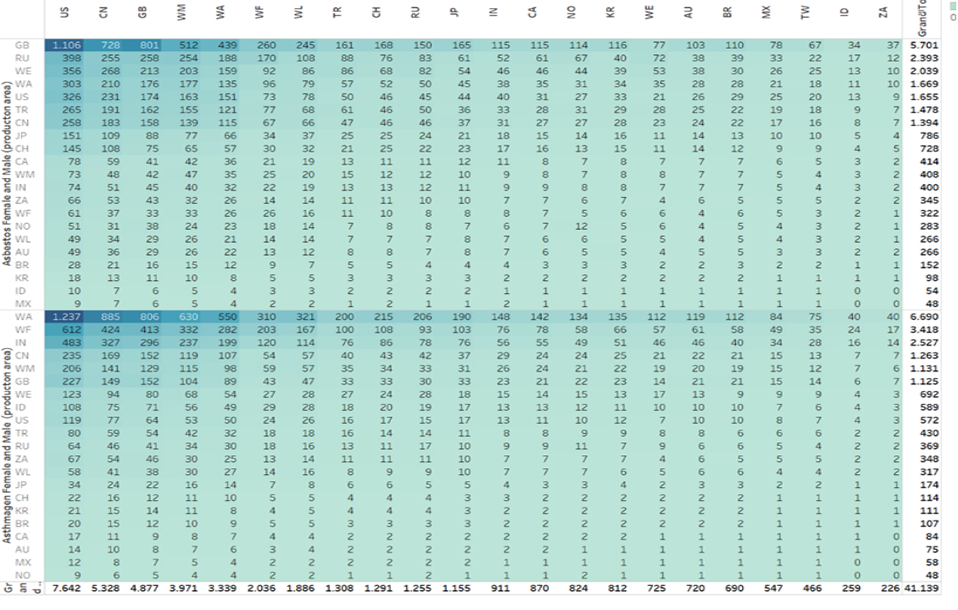
Figure 5 This figure represents the annual number of DALYs generated during the production of goods. Those goods present supply chains traversing the EU, which means they are produced outside of the EU, imported and transformed into the EU and then exported to be consumed outside the EU. The results are details for two particular exposures: asbestos and asthmagen. The countries in the lines on the left are where those goods have been produced, and the countries in the columns where the goods have been consumed.
4.3.4. The Significance of Maintaining a Broader Perspective
This methodology offers intriguing prospects for the European Union (EU). However, it is vital not to lose sight of the primary geostrategic objectives in the minutiae of such an approach. As explained above, if the EU employs this form of analysis to foster a socially equitable and environmentally efficient Green Deal, it will curtail its repercussions on other nations and promote a global elevation towards comprehensive and inclusive sustainable development.
However, it is equally critical to maintain a broader perspective and avoid an excessive focus on details that could potentially obscure the achievement of bigger core goals. For instance, the Disability-Adjusted Life Years (DALYs) and fatalities, both directly and indirectly associated with the EU, hold substantial relevance at the European level. Yet, their significance diminishes considerably on a global scale.
In this context, Figure 6 provides substantial insight. Extracted from an ongoing study (Berthet, Beaufils, et al., 2023) on the portrayal of Sustainable Development Goal (SDG) spillovers within a novel conceptual framework, this figure continues to convey the normalized SDG spillover scores between 1 and 100, akin to the Global Common Stewardship Index (GCSI). However, it also demonstrates how each world region’s scores are distributed between points attributed to the concerned externalities’ production, consumption, and trade.
As an illustration, SDG Indicator 8.1.1 portrayed in Figure 6, aggregates all the DALYs and fatalities discussed in the preceding sections for all global areas, not just the EU. Indicators indicator represents a “negative” externality, “producer country” points equate to those lost due to spillovers during the production of externalities. In contrast, “consumer country” points represent gains derived from importing externalities and spillovers generated in third countries. Lastly, “Trader Countries” neither gain nor lose SDG spillover points; instead, they denote the number of SDG points transiting through a specific country along its supply chains. The regions are marked, and the size of each sign is proportionate to the total number of points.
From Figure 6, it becomes evident that the EU indeed impacts these exchanges. However, if a global strategy aimed at mitigating the social implications of work-related fatalities through targeted trade measures (like trade bans or coalitions of trading countries) were to be implemented, incorporating Western Europe, Southeast Asia, and East Asia would drastically enhance global efficiency and limit spillovers.
In conclusion, the data underlines that adopting a nuanced, region-specific approach to regulatory reforms could make substantial strides towards achieving the SDGs. Such a strategy would necessitate global cooperation, tailored legislation, and a nuanced understanding of each geographical area’s unique challenges and opportunities.
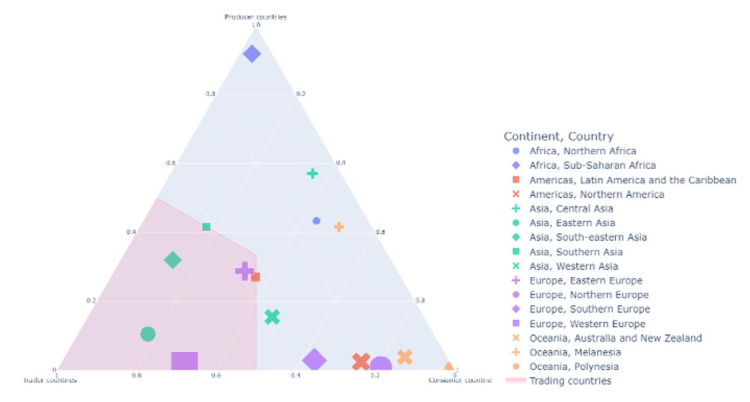
Figure 6 This figure is directly taken from a study in progress (Berthet, Beaufils, et al., 2023) on representing the SDG spillovers in a new conceptual framework. This new framework will indicate the normalized SDG spillover scores by a score between 1 and 100 (like the one used for spillovers in the GCSI). However, it will also illustrate how the score breaks down between the points attributable to the production, consumption, and trade of the externalities concerned. For instance, the SDG indicator represented in this Figure 6 is indicator 8.1.1, which aggregates all the DALYs and fatalities detailed in the sections above. Then, as this is a “negative” externality, the “producer countries” points are those lost due to the spillovers during the production of externalities, the “consumer countries” points are those gained thanks to the import of externalities and then the spillovers generated in third countries. Last, the “trader countries” are the countries that are not gaining nor losing SDG spillover points but show the number of SDG points that have traversed a particular country through the supply chains running along this country. The regions are indicated, and the size of the signs is proportional to the total number of points.
4.4. Utilizing Policy Tools to Enhance the EU’s Pursuit of Sustainable Development Goals
Finally, by investigating interdependence and the technical networks that drive interconnected relations, we have gained an important perspective for advancing some Sustainable Development Goals (SDGs), and the TBA framework is an important tool for deepening our understanding of spillover effects between countries, industries, and externalities. We are not suggesting here that the entire SDGs spectrum should be examined through the lens of the WI framework, nor are we proposing that deciphering the global flows of social and environmental externalities will resolve the research agenda brought by the new WI concept. However, the synergies and complementary aspects between both concepts are undeniable, and they share a common challenge: a better understanding of the world and the underlying networks to comprehend how various actors cooperate, are interdependent, and interact with one another.
This understanding has been illustrated with two examples, showcasing the potentially important role of the EU Green Deal in addressing two global externalities: deforestation and work-related accidents. It also shows that to enhance this role from an important role to a critical role, it is crucial to formulate effective policies that support those intents and improve international cooperation. Furthermore, this concept could be extended further. We could envisage international policies encompassing diverse objectives at the intersections between different networks, such as mitigating climate change, promoting well-being, and preventing tax evasion. This strategy could foster broad coalitions, providing a powerful lever for achieving the SDGs.
Moreover, this strategy provides valuable insight into addressing more contentious issues. For instance, in dealing with global spillovers related to GHG emissions, it is estimated that nearly 60% of oil and gas reserves and 90% of coal reserves must remain untapped to limit global warming to below 1.5 degrees Celsius (Welsby et al., 2021). How should we engage with nations that deliberately endanger humanity by exploiting these fossil fuel reserves? What are the risks of retaliation? What constitutes a just and proportionate response from other countries? As documented in the introduction, WI opens a pathway beyond simple economic coercion, enabling a more careful balancing of potential trade-offs, evaluation of retaliation risks, proportionate use of pressure, and determination of the ideal timing for cessation of such actions.
Utilizing weaponized interdependence should not be regarded as an end in itself but rather as a strategic tool to achieve specific policy objectives. In a reciprocal, mutualistic approach, a better understanding of one aspect can facilitate the resolution of the other, thereby unlocking the potential to design effective international sustainable policies and foster international cooperation. As Drezner et al. (2021) defined, “weaponized interdependence is states’ use of global economic networks to achieve geostrategic objectives.” If these geostrategic objectives align with the SDGs, a holistic approach to these interlinked challenges can lead the international community towards a more sustainable, secure, and equitable future. By leveraging the interconnected nature of our world and applying these strategic tools judiciously, we can navigate the complexities of our interdependent world and make significant strides towards achieving the Sustainable Development Goals.
4.5. Chapter references
Baker, S. (2013). Skating on stilts: Why we aren’t stopping tomorrow’s terrorism. Hoover Press.
Beaufils, T., Berthet, E., Ward, H., & Wenz, L. (2023). Beyond production and consumption : using throughflows to untangle the virtual trade of externalities. Economic Systems Research.
Berthet, E., Beaufils, T., Laurent, A., & Hauschild, M. (2023). Rethinking the impacts of international trade on the Sustainable Development Goals. Unpublished Work - under Peer Revisions.
Berthet, E., Fusacchia, I., & Antimiani, A. (2023). The EU initiative and the need for global action: Deforestation and Kairos. Unpublished Work - under Peer Revisions.
Commons, G., & Index, S. (2021). Global Commons Stewardship Index 2021. Safeguarding the shared resources of the planet. 1, 1–281. https://resources.unsdsn.org/global-commons-stewardship-index-2021
Council of the European Union. (2022). Proposal for a Regulation of the European Parliament and of the Council on the making available on the Union market as well as export from the Union of certain commodities and products associated with deforestation and forest degradation and repealing Reg.
Dahl, R. A. (1957). The concept of power. Behavioral Science, 2,201–215. https://doi.org/10.1002/bs.3830020303
Drezner, D. W., Farrell, H., & Newman, A. L. (2021). The Uses and Abuses of Weaponized Interdependence. Brookings Institution Press. https://books.google.dk/books?id=R7\_1DwAAQBAJ
Engström, R. E., Collste, D., Cornell, S. E., Johnson, F. X., Carlsen, H., Jaramillo, F., Finnveden, G., Destouni, G., Howells, M., Weitz, N., Palm, V., & Fuso-Nerini, F. (2021). Succeeding at home and abroad: accounting for the international spillovers of cities’ SDG actions. Npj Urban Sustainability, 1(1). https://doi.org/10.1038/s42949-020-00002-w
Eurostat. (2008). NACE Rev. 2 – Statistical classification of economic activities in the European Community. In Office for Official Publications of the European Communities.
Farrell, H., & Newman, A. L. (2019). Weaponized Interdependence: How Global Economic Networks Shape State Coercion. International Security, 44(1), 42–79. https://doi.org/10.1162isec_a_00351
Fusacchia, I., Berthet, E., & Antimiani, A. (2022). The Forest Content of Global Supply Chains: Which Mitigation Policy Options? 2022 International Agricultural Trade Research Consortium Annual Meeting. https://iatrc.umn.edu/2022-iatrc-annual-meeting/
Henders, S., Persson, U. M., & Kastner, T. (2015). Trading forests: Land-use change and carbon emissions embodied in production and exports of forest-risk commodities. Environmental Research Letters, 10(12). https://doi.org/10.1088/1748-9326/10/12/125012
Hoang, N. T., & Kanemoto, K. (2021). Mapping the deforestation footprint of nations reveals growing threat to tropical forests. Nature Ecology and Evolution, 5(6), 845–853. https://doi.org/10.1038/s41559-021-01417-z
International Labour Organization. (1981). C155 - Occupational Safety and Health Convention (No. 155).
International Labour Organization. (2006). C187 - Promotional Framework for Occupational Safety and Health Convention (No. 187).
Iyer, R., & Muncy, J. A. (2016). Attitude toward Consumption and Subjective Well-Being. Journal of Consumer Affairs, 50(1), 48–67. https://doi.org/10.1111/joca.12079
Jentleson, B. W. (2021). Weaponized Interdependence, The Dynamics of 21st Century Power, and U.S. Grand Strategy. In A. Drezner, D; Farrell, H; Newman (Ed.), The Uses and Abuses of Weaponized Interdependence (pp. 239–256). Brookings Institution Press.
Kagawa, S., Suh, S., Hubacek, K., Wiedmann, T., Nansai, K., & Minx, J. (2015). CO 2 emission clusters within global supply chain networks : Implications for climate change mitigation. Global Environmental Change, 35, 486–496. https://doi.org/10.1016/j.gloenvcha.2015.04.003
Liu, J., Dou, Y., Batistella, M., Challies, E., Connor, T., Friis, C., Millington, J. DA, Parish, E., Romulo, C. L., Silva, R. F. B., Triezenberg, H., Yang, H., Zhao, Z., Zimmerer, K. S., Huettmann, F., Treglia, M. L., Basher, Z., Chung, M. G., Herzberger, A., … Sun, J. (2018). Spillover systems in a telecoupled Anthropocene: typology, methods, and governance for global sustainability. Current Opinion in Environmental Sustainability, 33, 58–69. https://doi.org/10.1016/j.cosust.2018.04.009
Lowe, S. (2021). The EU’s carbon border adjustment mechanism How to make it work for developing countries. April.
Mancini, L., & Sala, S. (2018). Social impact assessment in the mining sector: Review and comparison of indicators frameworks. Resources Policy, 57(April 2017), 98–111. https://doi.org/10.1016/j.resourpol.2018.02.002
Miller, R. E., & Blair, P. D. (2009). Input–Output Analysis. Cambridge University Press. https://doi.org/10.1017/CBO9780511626982
Norris, C. B., Norris, G., & Aulisio, D. (2013). Social Hotspots Database. http://www.socialhotspot.org/
Norris, C., & Norris, G. (2015). Chapter 8: The Social Hotspots Database Context of the SHDB (pp. 52–73).
OECD/EC-JRC. (2021). Understanding the Spillovers and Transboundary Impacts of Public Policies. In Understanding the Spillovers and Transboundary Impacts of Public Policies: Implementing the 2030 Agenda for More Resilient Societies (OECD Publi). https://doi.org/10.1787/862c0db7-en
Pega, F., Náfrádi, B., Momen, N. C., Ujita, Y., Streicher, K. N., Prüss-Üstün, A. M., Descatha, A., Driscoll, T., Fischer, F. M., Godderis, L., Kiiver, H. M., Li, J., Magnusson Hanson, L. L., Rugulies, R., Sørensen, K., & Woodruff, T. J. (2021). Global, regional, and national burdens of ischemic heart disease and stroke attributable to exposure to long working hours for 194 countries, 2000–2016: A systematic analysis from the WHO/ILO Joint Estimates of the Work-related Burden of Disease and Injur. Environment International, 154(December 2020). https://doi.org/10.1016/j.envint.2021.106595
Pendrill, F., Gardner, T. A., Meyfroidt, P., Persson, U. M., Adams, J., Azevedo, T., Lima, M. G. B., Baumann, M., Curtis, P. G., De Sy, V., Garrett, R., Godar, J., Goldman, E. D., Hansen, M. C., Heilmayr, R., Herold, M., Kuemmerle, T., Lathuillière, M. J., Ribeiro, V., … West, C. (2022). Disentangling the numbers behind agriculture-driven tropical deforestation. Science, 377(6611). https://doi.org/10.1126/science.abm9267
Pendrill, F., Persson, U. M., Godar, J., Kastner, T., Moran, D., Schmidt, S., & Wood, R. (2019). Agricultural and forestry trade drives large share of tropical deforestation emissions. Global Environmental Change, 56(December 2018), 1–10. https://doi.org/10.1016/j.gloenvcha.2019.03.002
Perdana, S., & Vielle, M. (2022). Making the EU Carbon Border Adjustment Mechanism acceptable and climate friendly for least developed countries. Energy Policy, 170(January), 113245. https://doi.org/10.1016/j.enpol.2022.113245
Publications Office of the European Union. (2013). European Statistics on Accidents at Work (ESAW). In European Union. https://doi.org/10.2785/40882
Sachs, J., Kroll, C., Lafortune, G., Fuller, G., & Woelm, F. (2021). Sustainable Development Report 2021. In Sustainable Development Report 2021. https://doi.org/10.1017/9781009106559
Schmidt-Traub, G., Hoff, H., & Bernlöhr, M. (2019). International spillovers and the Sustainable Development Goals (SDGs). SDSN Policy Brief, 17.
Stadler, K., Wood, R., Bulavskaya, T., Södersten, C.-J., Simas, M., Schmidt, S., Usubiaga, A., Acosta-Fernández, J., Kuenen, J., Bruckner, M., Giljum, S., Lutter, S., Merciai, S., Schmidt, J. H., Theurl, M. C., Plutzar, C., Kastner, T., Eisenmenger, N., Erb, K.-H., … Tukker, A. (2018a). EXIOBASE 3: Developing a Time Series of Detailed Environmentally Extended Multi-Regional Input-Output Tables. Journal of Industrial Ecology, 22(3), 502–515. https://doi.org/https://doi.org/10.1111/jiec.12715
Stadler, K., Wood, R., Bulavskaya, T., Södersten, C. J., Simas, M., Schmidt, S., Usubiaga, A., Acosta-Fernández, J., Kuenen, J., Bruckner, M., Giljum, S., Lutter, S., Merciai, S., Schmidt, J. H., Theurl, M. C., Plutzar, C., Kastner, T., Eisenmenger, N., Erb, K. H., … Tukker, A. (2018b). EXIOBASE 3: Developing a Time Series of Detailed Environmentally Extended Multi-Regional Input-Output Tables. Journal of Industrial Ecology, 22(3), 502–515. https://doi.org/10.1111/jiec.12715
Szulecki, K., Overland, I., & Smith, I. D. (2022). The European Union’s CBAM as a de facto Climate Club: The Governance Challenges. Frontiers in Climate, 4(July), 1–6. https://doi.org/10.3389/fclim.2022.942583
Tian, K., Zhang, Y., Li, Y., Ming, X., Jiang, S., Duan, H., Yang, C., & Wang, S. (2022). Regional trade agreement burdens global carbon emissions mitigation. Nature Communications, 13(1), 1–12. https://doi.org/10.1038/s41467-022-28004-5
United Nations: New York, NY, U. (2015). Transforming our world: the 2030 Agenda for Sustainable Development. United Nations: New York, NY, USA.
Verkerk, P. J., Cardellini, G., Meijl, H. van., Pyka, A., & European Commission. Joint Research Centre. (2021). Future transitions for the bioeconomy towards sustainable development and a climate-neutral economy : modelling needs to integrate all three aspects of sustainability. https://doi.org/10.2760/097710
Walsh, F. (2006). UNEP-SETAC: GUIDELINES FOR SCLA of Product. In Environment.
Wiedmann, T., & Lenzen, M. (2018). Environmental and social footprints of international trade. Nature Geoscience, 11(5), 314–321. https://doi.org/10.1038/s41561-018-0113-9
Wiedmann, T. O., Schandl, H., Lenzen, M., Moran, D., Suh, S., West, J., & Kanemoto, K. (2015). The material footprint of nations. Proceedings of the National Academy of Sciences of the United States of America, 112(20), 6271–6276. https://doi.org/10.1073/pnas.1220362110
Winkler, K., Fuchs, R., Rounsevell, M., & Herold, M. (2021). Global land use changes are four times greater than previously estimated. Nature Communications, 12(1), 1–10. https://doi.org/10.1038/s41467-021-22702-2
Wood, R., Moran, D. D., Rodrigues, J. F. D., & Stadler, K. (2019). Variation in trends of consumption based carbon accounts. Scientific Data, 6(1), 1–9. https://doi.org/10.1038/s41597-019-0102-x
Wood, R., Stadler, K., Simas, M., Bulavskaya, T., Giljum, S., Lutter, S., & Tukker, A. (2018). Growth in Environmental Footprints and Environmental Impacts Embodied in Trade: Resource Efficiency Indicators from EXIOBASE3. Journal of Industrial Ecology, 22(3), 553–564. https://doi.org/10.1111/jiec.12735
World Health Organization. (2006). Asbestos - hazards and safe practice for clear-up after tsunami. https://www.who.int/publications/m/item/asbestos---hazards-and-safe-practice-for-clear-up-after-tsunami
Wright, T. J. (2017). All measures short of war: the contest for the twenty-first century and the future of American power. Yale University Press.
Xiao, H., Meng, B., Ye, J., & Li, S. (2020). Are global value chains truly global? Economic Systems Research, 32(4), 540–564. https://doi.org/10.1080/09535314.2020.1783643
Xu, Z., Li, Y., Chau, S. N., Dietz, T., Li, C., Wan, L., Zhang, J., Zhang, L., Li, Y., Chung, M. G., & Liu, J. (2020). Impacts of international trade on global sustainable development. Nature Sustainability, 3(11), 964–971. https://doi.org/10.1038/s41893-020-0572-z