7. The Interconnectedness of Natural Capital, Social Capital, Produced Capital, and Cultural Heritage in Sustainable Development
Authors
Halkos G., Chioatto E., Devves S.,
Landis C., Plataniotis A., Koundouri P.
7.1 Interconnected Capitals: The Foundation of Sustainable Development
The idea of sustainable development aims to achieve an equilibrium between human necessities and environmental well-being. It acknowledges the interrelation among three significant aspects which are natural capital, human capital, and produced capital (Figure 15). These components are all interconnected and play a critical role in promoting human well-being while preserving the environment for future generations (Dasgupta, P., 2021; Trim, I., 2022).
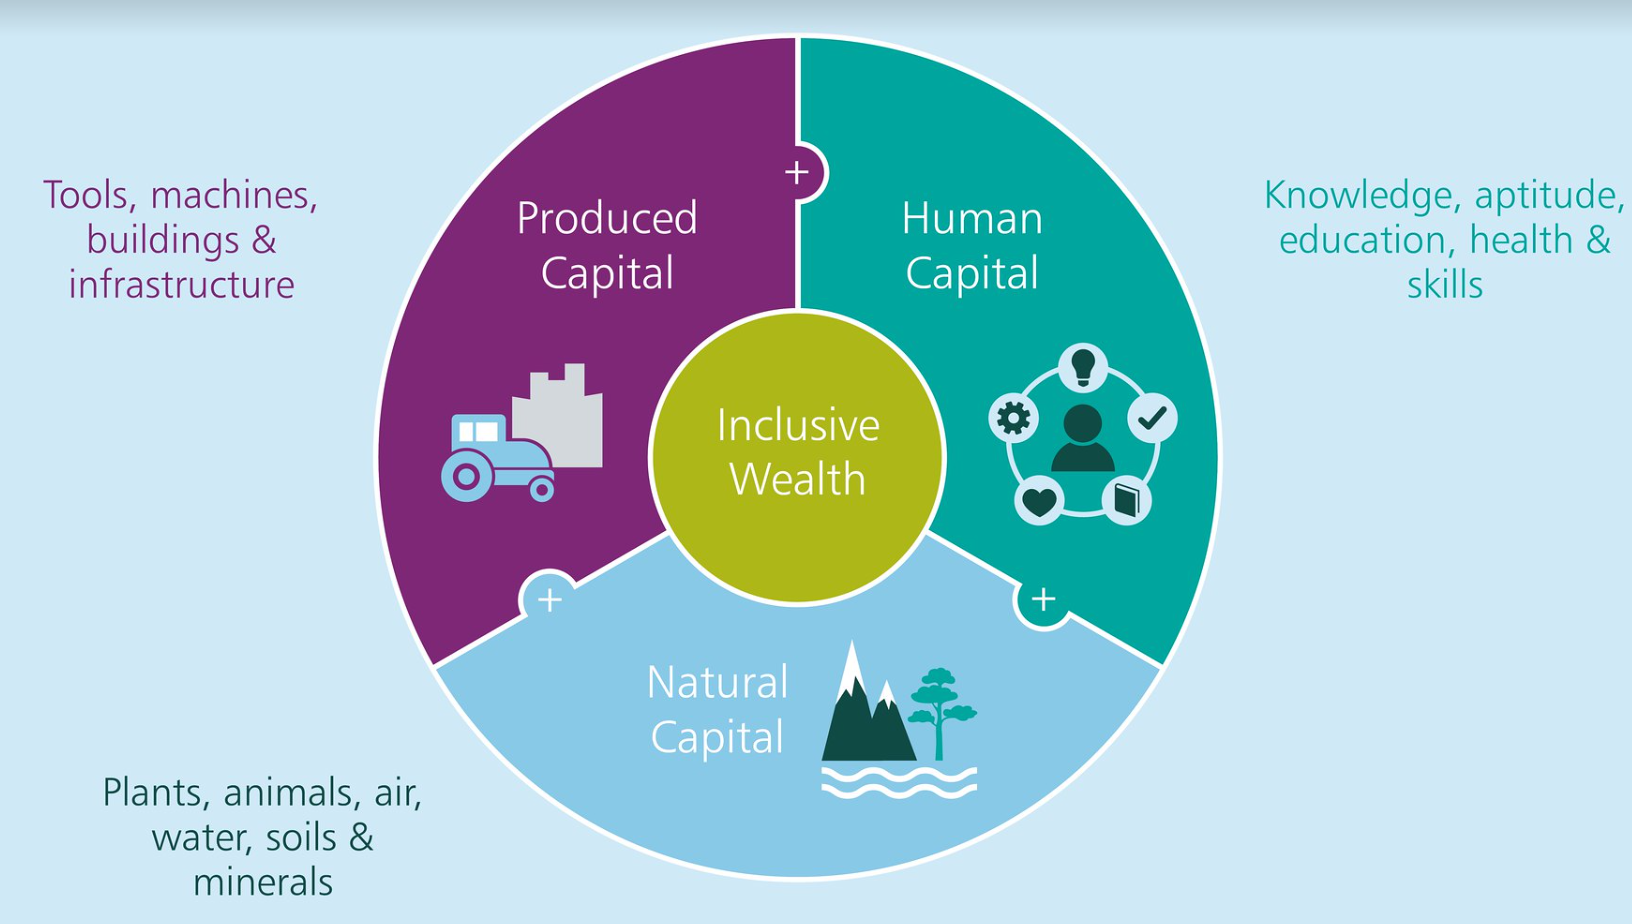
Natural capital encompasses the valuable resources that nature provides to support human life. It includes forests, oceans, rivers, as well as all species of plants and animals. These resources not only help people fulfil their immediate needs but also offer crucial ecosystem services that contribute to our overall well-being (Dasgupta, P., 2021).
Produced capital includes all the resources and assets that humans create to support their needs, including roads, buildings, infrastructure, and technology (Dasgupta, P., 2021).
Human capital, on the other hand, refers to people’s capabilities, skills and competencies that allow them to fulfil their objectives and make significant contributions towards the economy and society’s welfare (Dasgupta, P., 2021). Human capital is supported and improved by investments in education, healthcare, and social services.
Apart from natural, produced, and human capital, sustainable development also relies heavily on two other forms of capital: financial capital, namely the financial resources and assets that individuals, institutions, and governments draw upon to support economic activity and social capital, namely the networks and ties between individuals, groups, and organisations that are responsible for the generation of norms of trust, collaboration, and civic participation (Chetty, R., Jackson, M.O., Kuchler, T. et al., 2022 ; Setyari, N. P. W., et al. 2022). By fostering cooperation and collective action, social capital plays a vital role in achieving sustainable development goals (Adger, W. N. 2010).
One of the key elements of social capital is cultural heritage, as it contributes to a sense of identity and shared values. According to UNESCO, 2009, cultural heritage encompasses a wide range of items and locations, such as artifacts, monuments, architectural collections, and museums, which hold various symbolic, historical, artistic, aesthetic, ethnological, anthropological, scientific, and social values. This includes physical heritage, whether movable, stationary, or underwater, as well as intangible cultural heritage intertwined with cultural and natural heritage objects, sites, or monuments. Notably, this definition does not include aspects of intangible cultural heritage related to other cultural domains, such as festivals and celebrations. It also extends to industrial heritage and prehistoric cave art.
Recently, there has been increasing recognition of the need to identify and assess the value of cultural heritage assets to guide investments in maintenance and restoration programs (Riganti and Throsby 2021).
The tangible and intangible benefits of cultural heritage are many, including promoting social cohesion, identity, and a sense of place (Lenzerini, 2011). Cultural heritage can also help the economy grow through tourism and help people be more open-minded, creative, and innovative (Panzera, E., 2022). Cultural heritage is often closely tied to natural and produced capital, such as historical buildings and landscapes, which can be essential components of a region’s tourism industry, or traditional agricultural practices that may contribute to sustainable land use and biodiversity conservation. Therefore, it is very important to keep and protect cultural heritage for both the present and the future.
7.2 Valuing Cultural Heritage
The valuation of cultural heritage is a complex effort that requires considering the interaction of three pillars: environmental, social, and economic sustainability ([Nijkamp, P., 2012]). These pillars encompass various types of capital, including natural capital, human capital, and man-made capital, as described previously.
Economists with the purpose of applying the methodology of economic analysis to the valuation of heritage goods, have interpreted cultural heritage in economic terms, namely as cultural capital, hence an asset that gives rise to both economic and cultural value. The total economic value of cultural heritage goods can be decomposed in use values (i.e., values associated with direct, indirect and future use) and non-use values (i.e. derived from existence, bequest, and altruistic). On the other side, the cultural value, as Throsby (1999) reports, comprises aesthetic, spiritual, social, historical, symbolic, and authenticity. For cultural heritage goods classification, this study refers to the Cultural Heritage Classification from UNESCO (Figure 16).
Figure 16 Cultural Heritage Goods classification.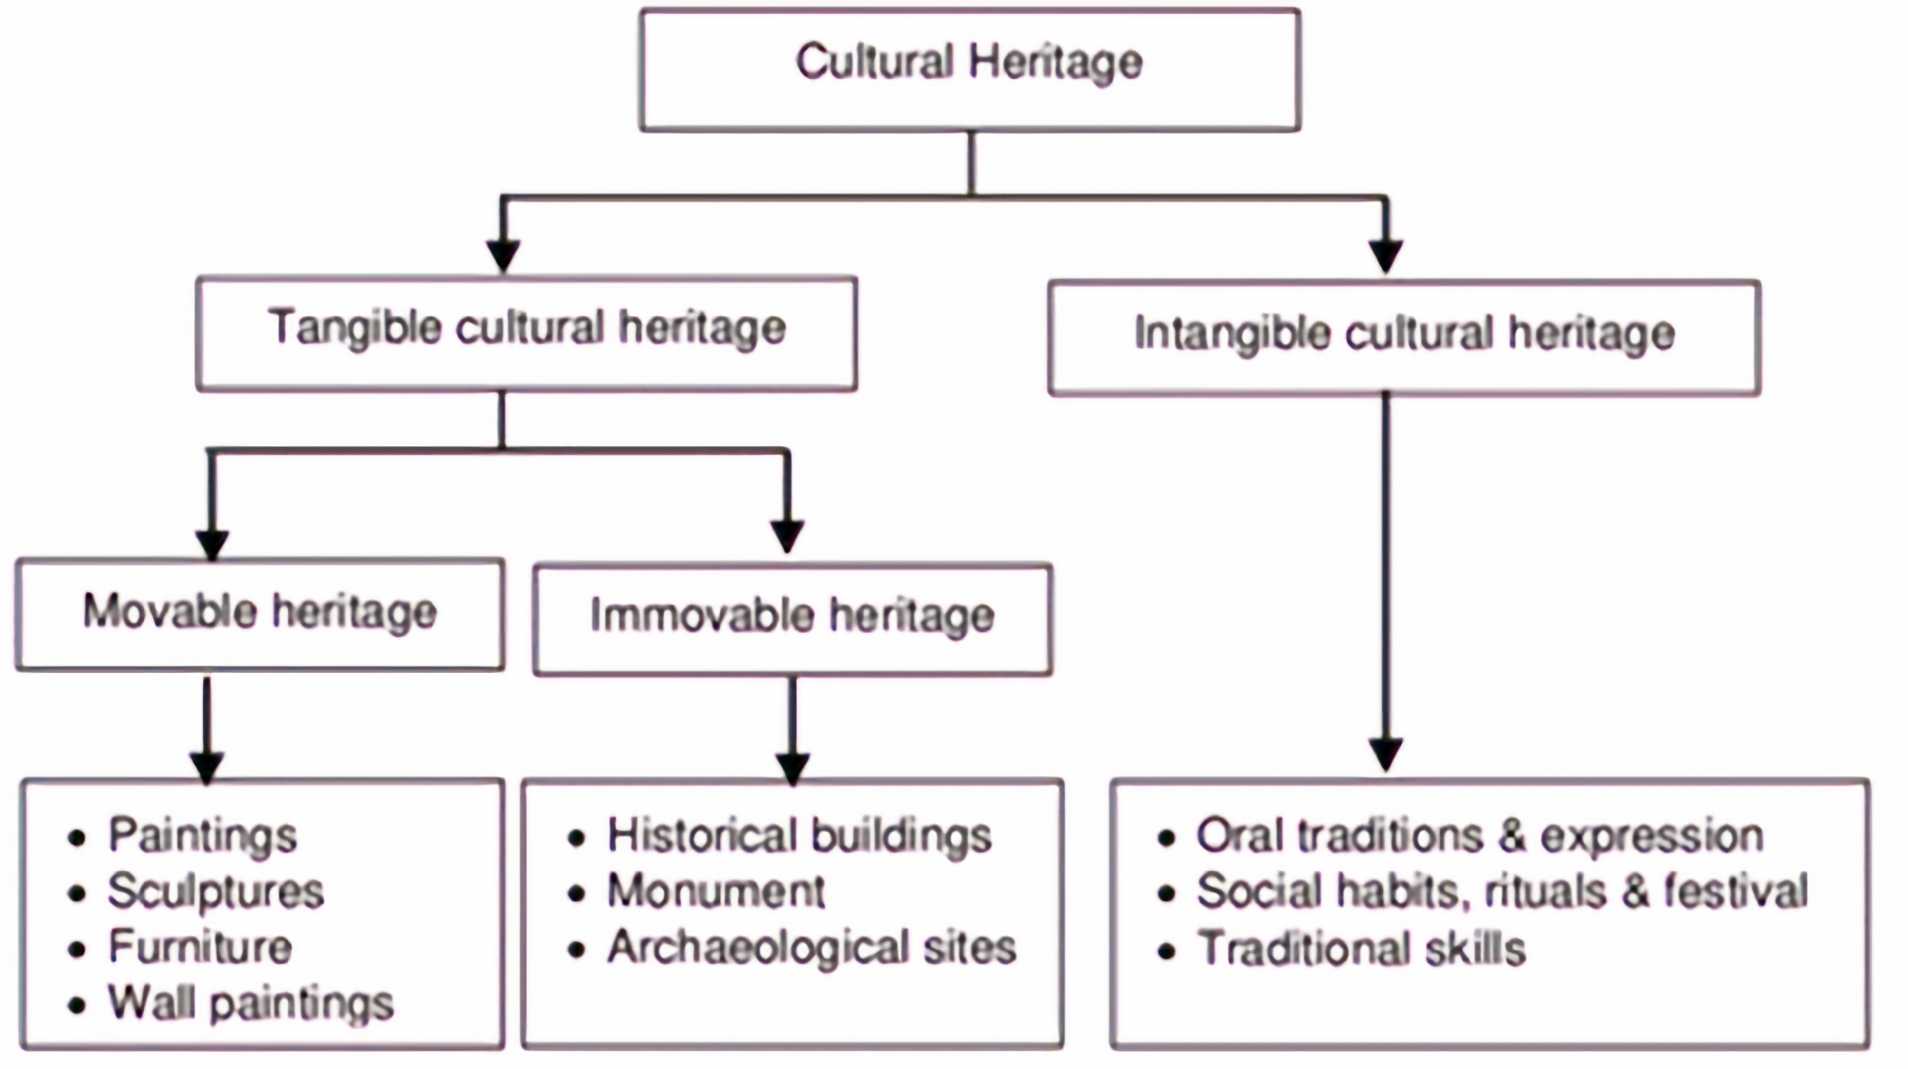
Source: UNESCO, 2003
The categorization of environmental values helps understanding the various dimensions of cultural heritage valuation. Anthropocentric values include total economic values, which comprise direct value, indirect value, option value, quasi-option value, bequest value, and existence value. Non-use value is also considered within anthropocentric values. Additionally, non-anthropocentric values, such as intrinsic values, contribute to the comprehensive assessment of cultural heritage.
Several methods are used for environmental valuation, including preferences-based approaches. Revealed preferences methods utilize market-based mechanisms, such as the production cost method, dose-response method, and producer or consumer surplus analysis. Alternatively, hypothetical markets can be created through techniques like hedonic pricing and the travel cost method (Figure 17). Stated preferences methods, specifically contingent valuation, and choice experiments, are also employed to estimate values for cultural goods, with contingent valuation being the most applied approach.
Figure 17 Methods of environmental valuation.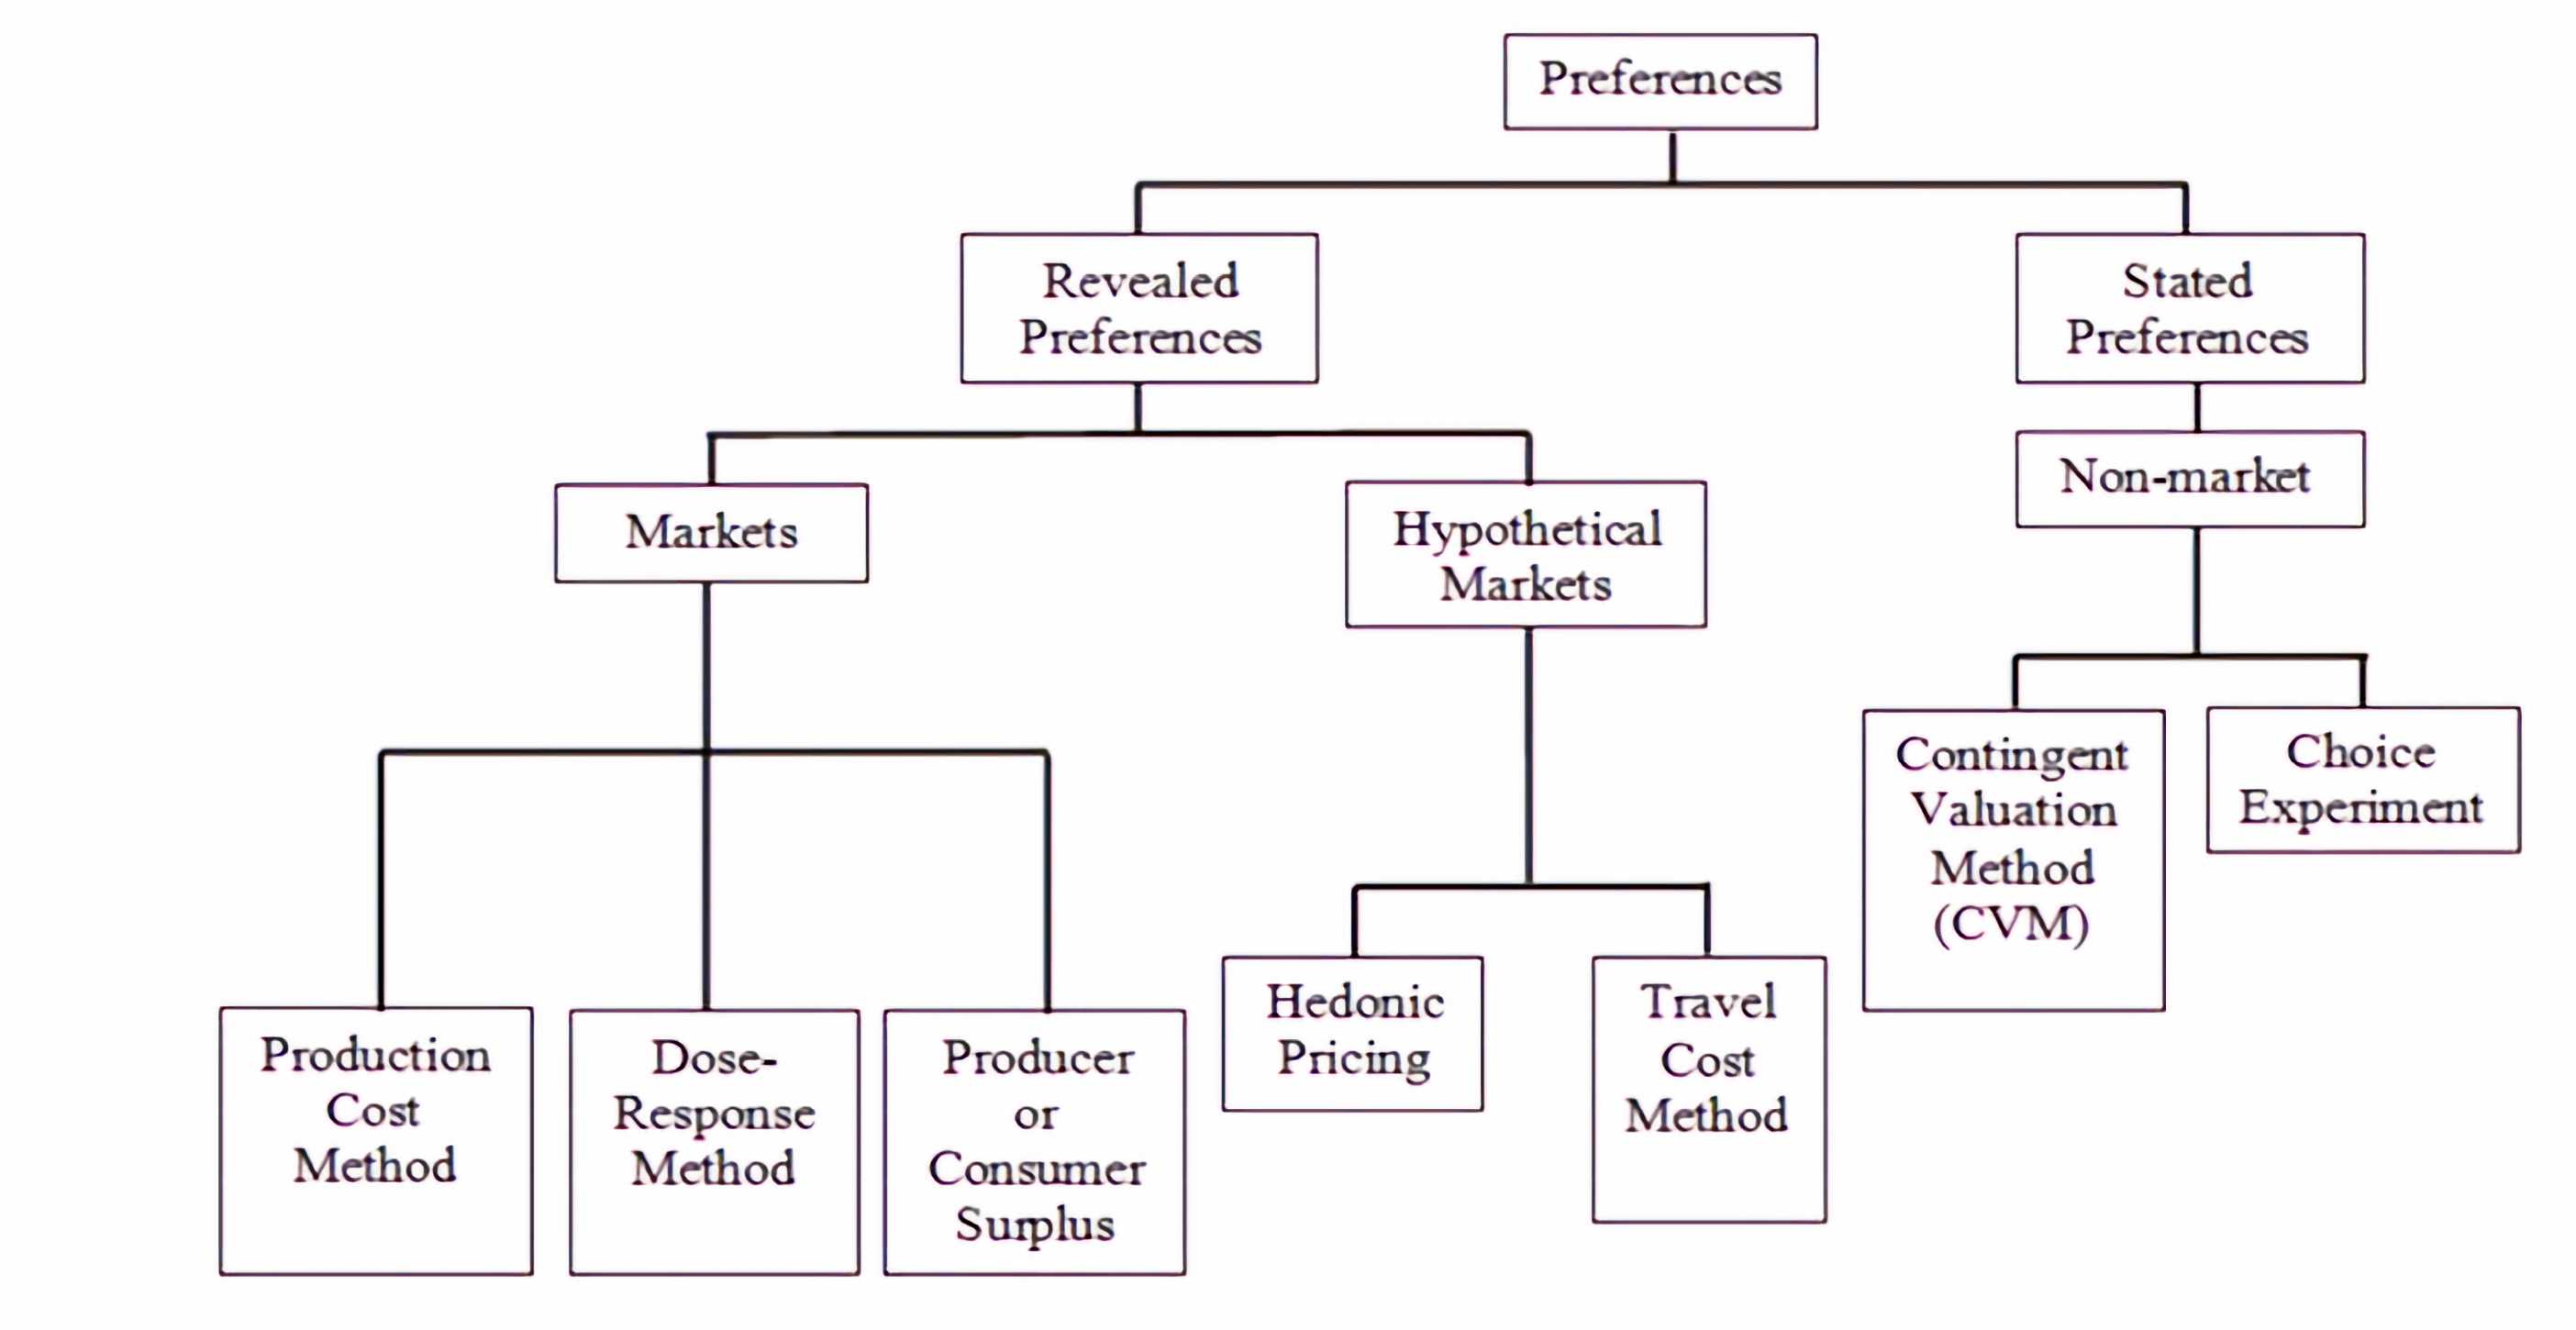
Source: Halkos, 2021
It is important to note that quantifying cultural capital is more challenging compared to other forms of capital. Cultural heritage comprises a range of assets and sites that often require maintenance, repair, or restoration. Unlike economic goods, cultural heritage cannot be easily substituted if damaged or lost. Since cultural goods are unique and irreplaceable, they lack markets for valuation purposes, making their assessment more intricate.
The classification of cultural heritage goods by UNESCO distinguishes between tangible and intangible cultural heritage. Tangible cultural heritage includes movable items like paintings, sculptures, furniture, and wall paintings, as well as immovable heritage like historical buildings, monuments, and archaeological sites. Intangible cultural heritage encompasses oral traditions and expressions, social habits, rituals and festivals, and traditional skills.
To determine the total economic value (TEV) of cultural goods, various factors and data are considered. The equation for TEV comprises use value (UV) and non-use value (NUV), which further consist of direct use value (DUV), indirect use value (IUV), option value (OV), quasi-option value (QOV), existence value, intrinsic value, bequest value, and synergistic value (Figure 18).
Figure 18 Categorization of Environmental values.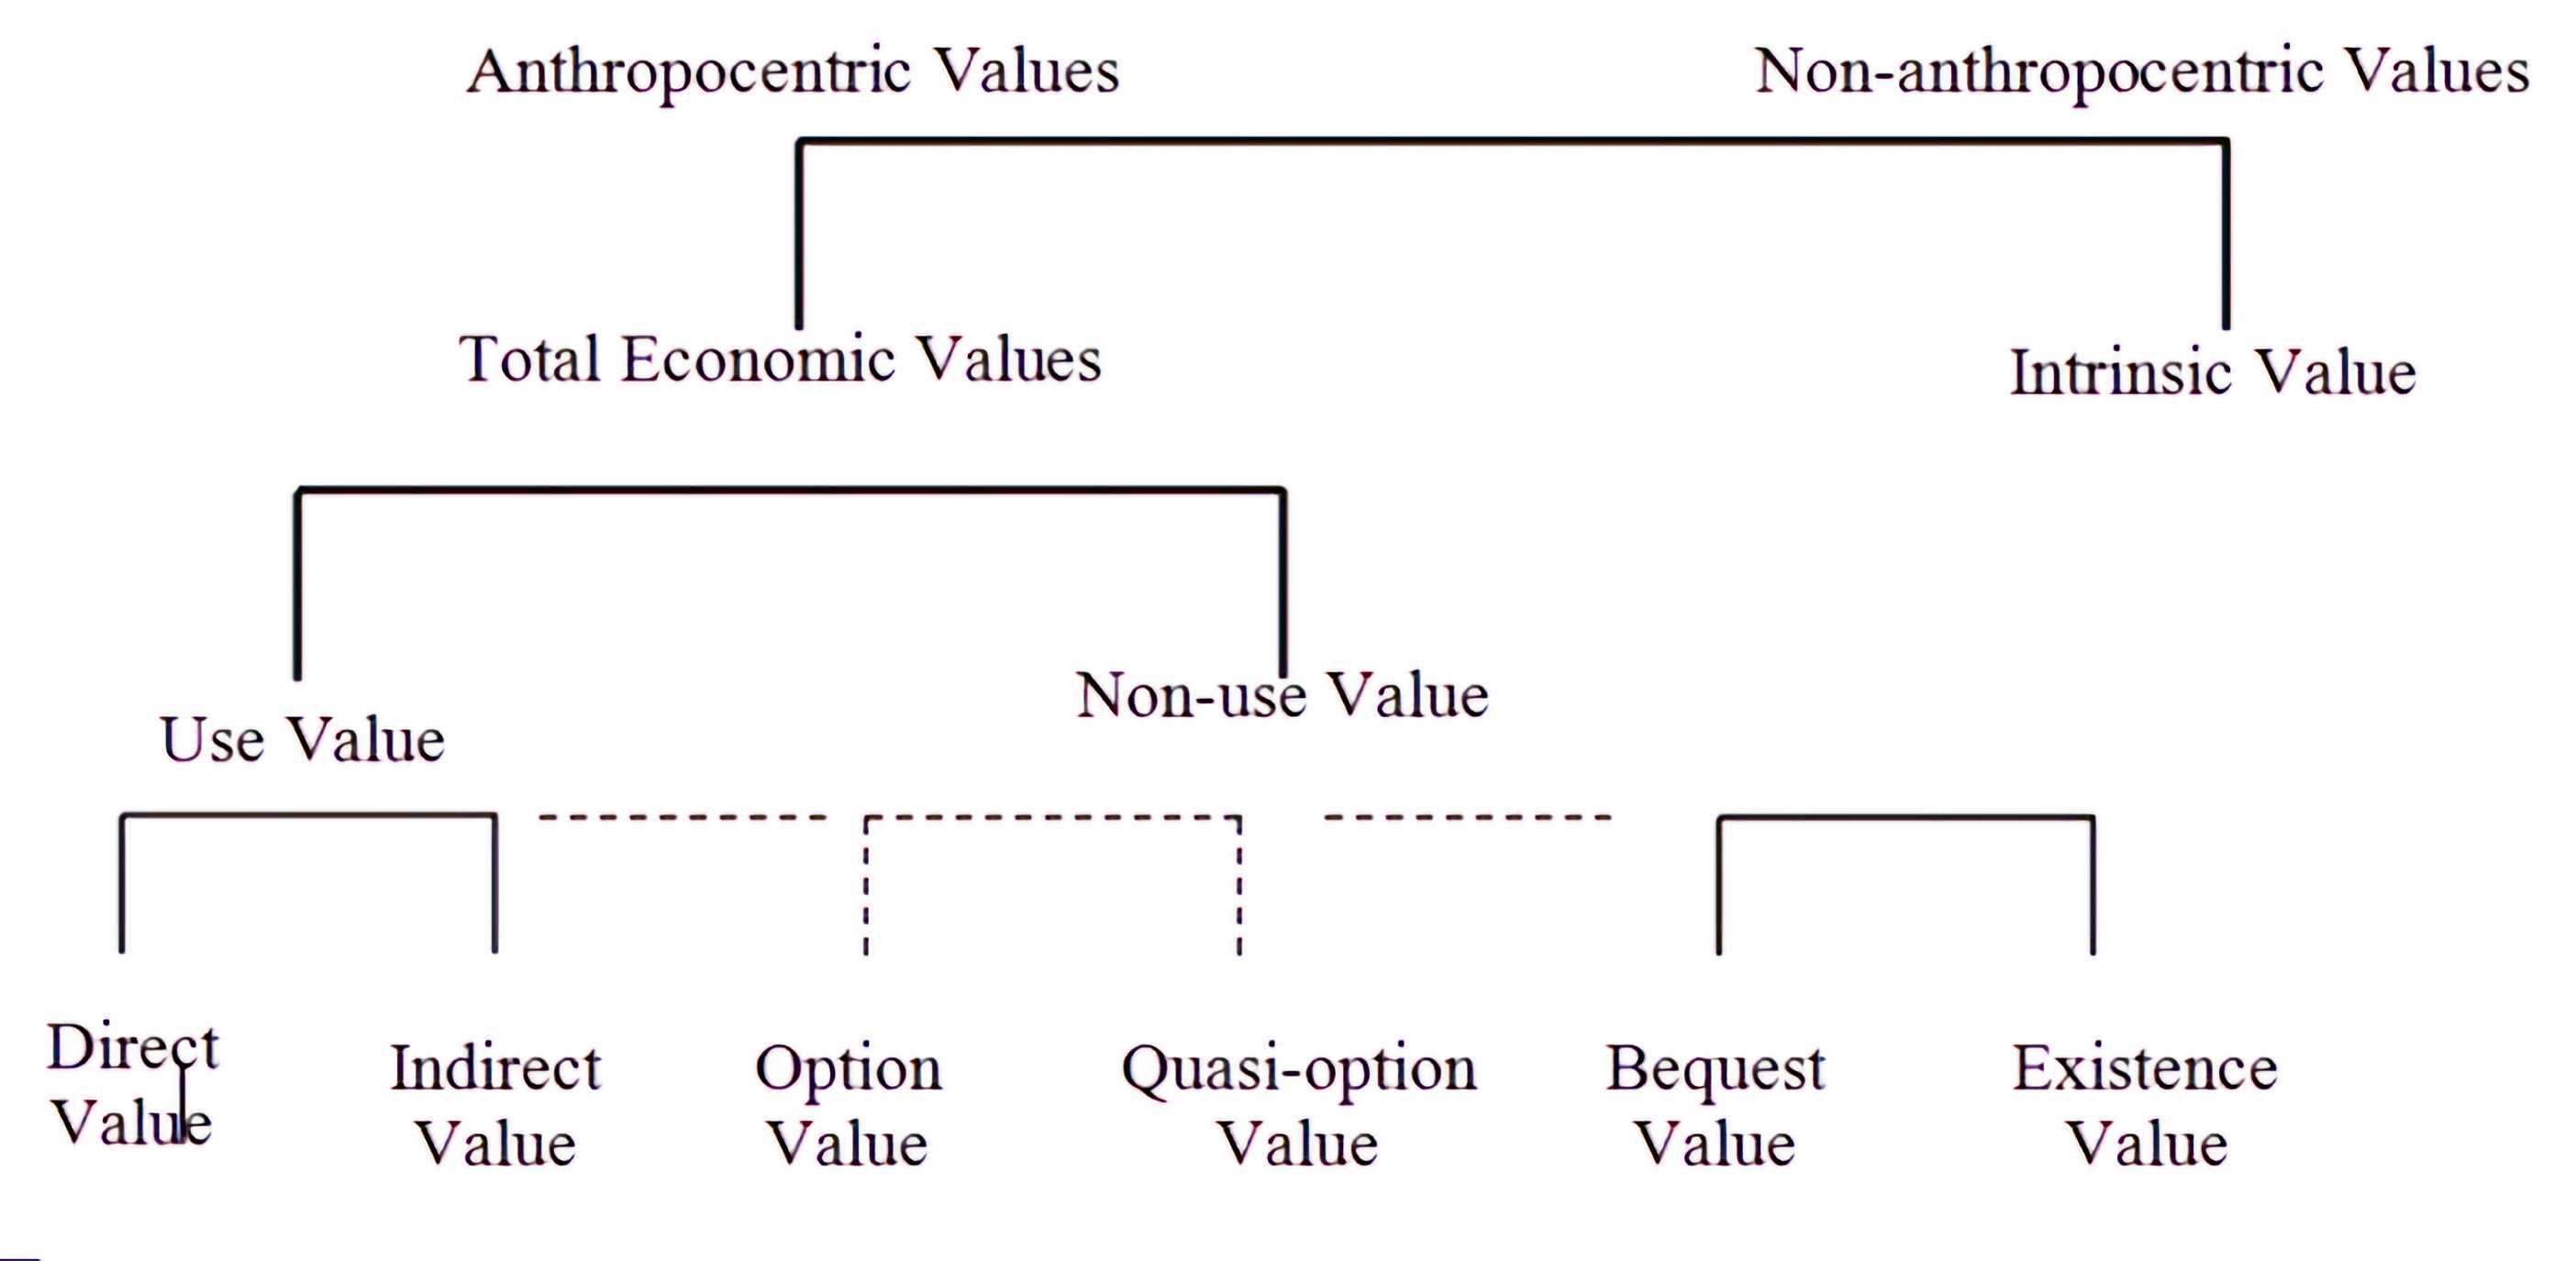
Source: Halkos, 2021
7.3 Methodology for Economic Valuation of Cultural Heritage Goods: A Meta-Regression Analysis Approach
Meta-regression analysis function transfer is utilized to synthesize empirical findings from multiple studies, with willingness to pay (WTP) being the dependent variable expressed in euros. This analysis involves estimating parameters for explanatory variables, such as the type of cultural goods (tangible or intangible), specific typologies of tangible and intangible goods, and the valuation method employed.
For robust value transfer, it is crucial that examined studies utilize reliable data and appropriate quantitative methods. Additionally, similarities in characteristics and populations of the studied sites are sought to minimize heterogeneity. The cultural value of heritage goods is often associated with aesthetic, spiritual, social, historical, symbolic, and authenticity factors. Socio-economic variables, including age, income, gender, and education level, are also considered in the valuation process.
7.3.1 Materials and Data
The aim of this study is the performance of an economic valuation of cultural heritage goods by relying on a meta-regression analysis function transfer. Data collection has been conducted by using the accessible literature in databases, such as Google scholar and semanticscholar. Primary literature and reviews related to cultural heritage valuation has been selected.
In total 107 studies published between 1995-2022 have been selected and used to elicit relevant information on actual cultural heritage willingness to pay.[1] Our dataset comprises and providing estimation of cultural heritage goods at the global level, separated into European and Non-European countries. More specifically, the dataset is composed by the following variables:
-
Study name: contains information about studies’ authors, name, journal, and year of publication.
-
Willingness to pay is a continuous variable which expresses the annual mean willingness to pay (in euros) for cultural services. In cases in which the value of the willingness to pay was expressed in a currency other than euro, the exchange rate of the current year in which the study was developed was applied. In some studies consumers surplus values have been considered as equal to willingness to pay. In the estimation, the willingness to pay variable will be considered as the dependent variable.
-
Year of study development indicates the year of data collection.
-
Year of study publication
-
Aera: is a categorical variable indicating if the study refers to a cultural heritage site inside Europe or outside Europe
-
Country: is a categorical variable reporting the country in which the analysis has been developed
-
Location: is a categorical variable reporting the geographical location in which the analysis has been developed.
-
Valuation method: is a categorical variable indicating the method used to develop the analysis. For Contingent Valuation and Choice Experiment we assign 1, and 2 otherwise (Stated preference, Travel cost, etc).
Various explanatory variables were considered to identify cultural heritage goods in accordance with UNESCO definition, namely:
-
Tangible, Intangible are two dummies’ variables, which assume value of 1 if the study provides monetary value for tangible goods or intangible goods, and value of 0 otherwise.
-
Paintings, Sculpture, Furniture, Wall, Historical buildings, Monument, Archaeological sites: are dummy variables indicating seven typologies of tangible cultural heritage goods. They assume value of 1 if the study provides monetary value for the specific tangible good, and value of 0 otherwise.
-
Oral traditions, social habits, Traditional skills: are dummy variables indicating three typologies of intangible cultural heritage goods. They assume value of 1 if the study provides monetary value for the specific intangible good, and value of 0 otherwise.
-
Various explanatory variables were considered to identify the economic and cultural value of heritage goods, in accordance with Riganti and Throsby (2021) and Throsby (1999), namely:
-
Existence, Bequest are dummy variables indicating the economic value of cultural capital. They assume value of 1 if the study has derived existence or bequest value, and 0 otherwise.
-
Aesthetic, Spiritual, Social, Historical, Symbolic, and Authenticity.: are dummy variables indicating the cultural value generated by cultural capital. They assume value of 1 if according to authors’ interpretation the study represents as a proxy the valuation of the above-mentioned cultural values, and 0 otherwise.
-
As socio-economic variables, we have considered the following:
-
Age: is a continuous variable indicating the mean age of the sample population expressed in years. For studies in which age data were not available, we extracted that information from sources like https://www.worldometers.info/ .
-
Income: is a continuous variable indicating the mean annual income of the sample population in euro. In the studies in which, monthly annual income was provided, the monthly amount has been multiplied per twelve months. In cases in which the value of annual income was expressed in a currency other than euro, the exchange rate of the current year in which the study was developed was applied. For studies in which income data were not available, we extracted that information from webpages providing official statistics, such as https://ec.europa.eu/eurostat , https://www.ceicdata.com/, https://tradingeconomics.com, and https://www.census.gov. Eurostat database provides mean equivalised net income by year.
-
Gender: indicates the percentage of male and female in the sample population. It is assumed female =1. For studies in which gender data were not available for the population, we extracted that information from webpages providing official statistics, such as https://www.statista.com and https://statisticstimes.com .
-
Education: indicates the percentage of the sample population that have a high education level. It is assumed university degree=1. In case in which educational level data were not available, we extracted relevant information from webpages providing official statistics, such as https://uis.unesco.org/ that adopt the International Standard Classification of Education (ISCED).
7.3.2 Empirical Findings
Relying on the above information Table 8 and Table 9 provide the basic descriptive statistics, while Table 10
and Table 11 presents the correlation coefficients of the variables considered.
Table 8 Descriptive statistics A
| WTP | AGE | CV_AESTHETIC | CV_AUTHENTICITY | CV_HISTORICAL | CV_SYMBOLIC | EDUCATION | EV_BEQUEST | EV_EXISTENCE | GENDER | INCOME_YEAR | |
|---|---|---|---|---|---|---|---|---|---|---|---|
| Mean | 38.463 | 40.020 | 0.5200 | 0.5800 | 0.5000 | 0.6400 | 4.4728 | 0.3600 | 0.6600 | 5.0050 | 19.389 |
| Median | 15.530 | 40.000 | 1.0000 | 1.0000 | 0.5000 | 1.0000 | 4.5000 | 0.0000 | 1.0000 | 5.1000 | 15.676 |
| Maximum | 343.00 | 53.000 | 1.0000 | 1.0000 | 1.0000 | 1.0000 | 14.850 | 1.0000 | 1.0000 | 5.7000 | 50.000 |
| Minimum | 2.4700 | 28.000 | 0.0000 | 0.0000 | 0.0000 | 0.0000 | 1.0700 | 0.0000 | 0.0000 | 2.4000 | 1.6650 |
| Std. Dev. | 56.471 | 5.2274 | 0.5046 | 0.4985 | 0.5050 | 0.4848 | 3.4207 | 0.4848 | 0.4785 | 0.4252 | 11.404 |
| Skewness | 3.4996 | 0.2604 | -0.0800 | -0.3241 | 0.0000 | -0.5833 | 1.2271 | 0.5833 | -0.6755 | -4.7881 | 0.4727 |
| Kurtosis | 18.227 | 2.5953 | 1.0064 | 1.1050 | 1.0000 | 1.3402 | 4.5730 | 1.3402 | 1.4563 | 29.702 | 2.8519 |
| Jarque-Bera | 585.12 | 0.9063 | 8.3334 | 8.3563 | 8.3333 | 8.5745 | 17.704 | 8.5745 | 8.7671 | 1676.4 | 1.9084 |
| Probability | 0.0000 | 0.6356 | 0.0155 | 0.0153 | 0.0155 | 0.0137 | 0.0001 | 0.0137 | 0.0124 | 0.0000 | 0.3851 |
| Observations | 50 | 50 | 50 | 50 | 50 | 50 | 50 | 50 | 50 | 50 | 50 |
Table 9 Descriptive statistics B
| INTANGIBLE_GOODS | INTANGIBLE_ORAL_TRADITIO | INTANGIBLE_SOCIAL_HABITS | INTANGIBLE_TRADITIONAL_S | TANGIBLE_ARCHEOGOGICAL_S | TANGIBLE_GOODS | TANGIBLE_HISTORICAL_BUIL | TANGIBLE_MONUMENTS | TANGIBLE_PAINTINGS | TANGIBLE_SCULPTURES | TANGIBLE_WALL | |
|---|---|---|---|---|---|---|---|---|---|---|---|
| Mean | 0.5490 | 0.1372 | 0.2745 | 0.4509 | 0.1372 | 0.5098 | 0.3725 | 0.1960 | 0.0980 | 0.1176 | 0.058824 |
| Median | 1.0000 | 0.0000 | 0.0000 | 0.0000 | 0.0000 | 1.0000 | 0.0000 | 0.0000 | 0.0000 | 0.0000 | 0.000000 |
| Maximum | 1.0000 | 1.0000 | 1.0000 | 1.0000 | 1.0000 | 1.0000 | 1.0000 | 1.0000 | 1.0000 | 1.0000 | 1.000000 |
| Minimum | 0.0000 | 0.0000 | 0.0000 | 0.0000 | 0.0000 | 0.0000 | 0.0000 | 0.0000 | 0.0000 | 0.0000 | 0.000000 |
| Std. Dev. | 0.5025 | 0.3470 | 0.4507 | 0.5025 | 0.3475 | 0.5048 | 0.4882 | 0.4009 | 0.3003 | 0.3253 | 0.237635 |
| Skewness | -0.1970 | 2.1081 | 1.0105 | 0.1970 | 2.1082 | -0.0392 | 0.5272 | 1.5309 | 2.7034 | 2.3734 | 3.750000 |
| Kurtosis | 1.0388 | 5.4448 | 2.0212 | 1.0388 | 5.4446 | 1.0015 | 1.2779 | 3.3439 | 8.3086 | 6.6333 | 15.06250 |
| Jarque-Bera | 8.5032 | 50.482 | 10.716 | 8.5032 | 50.482 | 8.5000 | 8.6641 | 20.174 | 122.01 | 75.935 | 428.7271 |
| Probability | 0.0142 | 0.0000 | 0.0047 | 0.0142 | 0.0000 | 0.0142 | 0.0131 | 0.0000 | 0.0000 | 0.0000 | 0.000000 |
| Observations | 51 | 51 | 51 | 51 | 51 | 51 | 51 | 51 | 51 | 51 | 51 |
Table 10 Correlation coefficients A
| CV_AESTHETIC | CV_AUTHENTICITY | CV_HISTORICAL | CV_SOCIAL | CV_SPIRITUAL | CV_SYMBOLIC | TANGIBLE_ARCHEOGOGICAL_S | TANGIBLE_GOODS | TANGIBLE_HISTORICAL_BUIL | TANGIBLE_MONUMENTS | TANGIBLE_PAINTINGS | TANGIBLE_SCULPTURES | TANGIBLE_WALL | |
|---|---|---|---|---|---|---|---|---|---|---|---|---|---|
| CV_AESTHETIC | 1 | 0.3179 | -0.24 | -0.0099 | -0.073 | 0.1134 | -0.073 | -0.2019 | -0.155 | -0.22 | -0.346 | -0.384 | 0.0741 |
| CV_AUTHENTI | 0.3179 | 1 | -0.121 | 0.168 | -0.1237 | 0.5436 | -0.123 | -0.1687 | -0.168 | 0.121 | 0.148 | 0.189 | 0.044 |
| CV_HISTORICAL | -0.24 | -0.121 | 1 | -0.453 | 0.288 | 5.088 | 0.403 | 0.640 | 0.453 | 0.3 | -0.067 | -6.8329 | 0.2526 |
| CV_SOCIAL | -0.0099 | 0.1686 | -0.453 | 1 | -0.277 | 0.185 | -0.159 | -0.587 | -0.49 | -0.123 | 0.123 | 0.035 | -0.149 |
| CV_SPIRITUAL | -0.07 | -0.1237 | 0.288 | -0.277 | 1 | 0.0624 | 0.003 | 0.1569 | 0.159 | 0.086 | 0.0574 | 0.028 | -0.1019 |
| CV_SYMBOLIC | 0.1134 | 0.543 | 5.0885 | 0.1854 | 0.0624 | 1 | -0.0576 | -0.0533 | -0.185 | 0.062 | 0.111 | 0.02 | 0.1894 |
| TAN_ARCH_S | -0.073 | -0.1237 | 0.403 | -0.1591 | 0.003 | -0.0576 | 1 | 0.3876 | 0.396 | -0.057 | -0.134 | -0.148 | 0.14 |
| TAN_GOODS | -0.2019 | -0.168 | 0.6405 | -0.587 | 0.1569 | -0.053 | 0.387 | 1 | 0.752 | 0.48 | 0.320 | 0.354 | 0.242 |
| TAN_HISTO_BUIL | -0.155 | -0.168 | 0.453 | -0.490 | 0.15 | -0.185 | 0.3966 | 0.752 | 1 | 0.432 | 0.288 | 0.218 | -0.1977 |
| TAN_MONUMEN | -0.2201 | 0.121 | 0.3 | -0.1236 | 0.08 | 0.062 | -0.057 | 0.480 | 0.432 | 1 | 0.5 | 0.43 | -0.1263 |
| TAN_PAINTINGS | -0.3469 | 0.1485 | -0.067 | 0.123 | 0.057 | 0.111 | -0.134 | 0.320 | 0.288 | 0.5 | 1 | 0.90 | -0.084 |
| TAN_SCULPTUR | -0.3843 | 0.1895 | -6.8329 | 0.0355 | 0.0283 | 0.020 | -0.1489 | 0.354 | 0.218 | 0.4308 | 0.902 | 1 | -0.0932 |
| TANGIBLE_WALL | 0.0741 | 0.0443 | 0.2526 | -0.149 | -0.1019 | 0.189 | 0.1407 | 0.2427 | -0.1977 | -0.1263 | -0.084 | -0.093 | 1 |
Table 11 Correlation coefficients B
| CV_AESTHETIC | CV_AUTHENTICITY | CV_HISTORICAL | CV_SOCIAL | CV_SPIRITUAL | CV_SYMBOLIC | INTANGIBLE_GOODS | INTANGIBLE_ORAL_TRADITIO | INTANGIBLE_SOCIAL_HABITS | INTANGIBLE_TRADITIONAL_S | |
|---|---|---|---|---|---|---|---|---|---|---|
| CV_AESTH | 1 | 0.3179 | -0.24 | -0.0099 | -0.073 | 0.113 | 0.0771 | -0.189 | -0.34 | 0.20 |
| CV_AUTHE | 0.317 | 1 | -0.12 | 0.1686 | -0.123 | 0.543 | 0.108 | -0.123 | -0.234 | 0.346 |
| CV_HISTOR | -0.24 | -0.1215 | 1 | -0.4532 | 0.28 | 5.088 | -0.521 | 0.0576 | -0.0455 | -0.483 |
| CV_SOCIAL | -0.009 | 0.168 | -0.453 | 1 | -0.277 | 0.18 | 0.682 | 0.078 | 0.3701 | 0.527 |
| CV_SPIRITU | -0.073 | -0.123 | 0.288 | -0.277 | 1 | 0.062 | -0.09 | 0.169 | 0.0236 | -0.009 |
| CV_SYMBOL | 0.113 | 0.54 | 5.088 | 0.185 | 0.062 | 1 | 0.143 | -0.057 | -0.2203 | 0.245 |
| INT_GOODS | 0.077 | 0.108 | -0.521 | 0.682 | -0.090 | 0.143 | 1 | 0.372 | 0.547 | 0.81 |
| INT_ORA_TRAD | -0.19 | -0.123 | 0.057 | 0.078 | 0.169 | -0.0576 | 0.37 | 1 | 0.5492 | 0.222 |
| INT_SOCI_HAB | -0.34 | -0.23 | -0.045 | 0.37 | 0.023 | -0.22 | 0.547 | 0.5492 | 1 | 0.209 |
| INT_TRADIT_S | 0.206 | 0.346 | -0.483 | 0.527 | -0.006 | 0.245 | 0.818 | 0.222 | 0.209 | 1 |
Next, we performed various stepwise specifications of the variables considered being slightly elastic in the individual statistical significance of the explanatory variables. That is apart from the usual levels (of α= 0.05, α=0.01 and α=0.1) we have considered (in such analysis) P-values less than 0.25. We have divided our analysis into European and non-European studies. For the former the number of studies considered was 51, while for the latter we have considered 55 studies.
Based on these, Table 12 provides the specifications of the variables considered in our analysis. The first column presents the variables considered and various diagnostics. Columns 2 and 3 refer to the specifications for the European countries, while columns 4 and 5 refer to the non-European countries’ specifications. Even more, columns 2 and 4 correspond to simplified specifications mainly on cultural values (considered as simple), whilst columns 3 and 5 correspond to more extended specifications with the addition of tangible and intangible cultural heritage distinctions (considered as full). Table 11 accompanies these specifications with the provision of the correlation coefficients as an initial indication of any possible multicollinearity problems.
Concerning the demographic variables, gender is significant at all levels in the simple European specification, as well as in the simple non-European specification if we allow for P-values higher than the typical ones (as explained before). Income is influential in all specifications, although significant in the non-European and in the European cases of the full specifications. Education significantly affects the European specifications (at all levels in the full and with elastic P-values assumed in the simple), while in the non-European case only in the full specification and is we allow P-values less or equal to 0.25. Finally, age seems to be affecting only the non-European countries setup and with the elastic P-values assumption.
Moving on the cultural values, aesthetic affect significantly the European specifications, while authentication seems significant in the simple non-European specification and marginally in the simple European with the elastic P-values assumed. Spiritual cultural values significantly affect the European specifications and in elastic P-values the full non-European setup. Symbolic and social cultural values seem to affect the non-European countries.
If we consider the intangible classifications then goods, social habits and tradition are significant in the full European and non-European specifications, while oral tradition is significant in the full non-European specification. With reference to tangible distinction, archaeological, historical buildings and paintings are statistically significant in the full European specification.
The expected problem of heteroskedasticity is tested using Glejser and White tests among others with no indication of problems in our specification with only one exception in the case of the full non-European specification and for the Glejser test only. Similarly, there is not any ARCH effect in any of the specifications, Also the R2 adjusted are higher in the full specifications having values around 0.41-0.51 and lower values in the simple specifications.
The Total WTP is yearly and presents no difference between the simple and the full specifications in European specifications and some difference in the non-European specifications. Specifically, in the European specifications we have values around €37 (€36.9 and €37.6 for the simple and the full specifications respectively), while in the non-European specifications we have higher and different values of €50.5 and €60.12 for the simple and the full specifications respectively.
It seems that the distinction of intangible cultural heritage affects statistically both the European and non-European specifications, while the tangible significantly affects the European ones. Aesthetic and Spiritual values affect the European countries specifications.
Table 12 Regression specifications
| Variables | European countries (n=51) | European countries (n=51) | Non- European countries (n=55) | Non- European countries (n=5 5)* |
| Gender | 14.59 [0.0053] | 6.0393 [ 0.3536] | -8,3163 [ 0.1818] | |
| Income | -0.7477 [0.3069] | -1.0532 [ 0.1177] | -0.0772 [ 0.3506] | -0.2461 [ 0.0586] |
| Education | 3.311 [0.1787] | 8.003 [ 0.0074] | -10.479 [ 0.2434] | |
| Age | 1.4511 [ 0.1288] | |||
| CV_Aesthetic | -35.206 [0.0453] | -63.565 [ 0.0018] | 17.808 [ 0.4664] | |
| CV_ Authentification | -20.902 [0.2503] | 72.208 [ 0.0272] | 32.954 [ 0.2798] | |
| CV_ Spiritual | -42.152 [0.0827] | -50.085 [ 0.0252] | -40.789 [ 0.2342] | |
| CV_Symbolic | 32.338 [ 0.2036] | |||
| CV_Social | 70.156 [ 0.0313] | 38.088 [ 0.2361] | ||
| EV_Existencec | 30.725 [ 0.3462] | |||
| IntangibleGoods | 114.31 [ 0.0114] | 52.489 [ 0.1014] | 164.1822 [ 0.0238] | |
| Intangible Social Habits | -50.523 [ 0.0582] | -177.96 [ 0.0551] | ||
| Intangible Tradition | -57.203 [ 0.0512] | 147.2847 [ 0.0164] | ||
| Intangible Oral Tradition | -168.75 [ 0.0034] | |||
| Tangible Archaeological | -78.612 [ 0.0017] | |||
| Tangible Historical Buildings | 73.53 [ 0.0083] | |||
| Tangible Paintings | -77.822 [ 0.0077] | |||
| R-square | 0.15 | 0.41 | 0.23 | 0.51 |
| ARCH effect test | 0.1279 [0.7206] | 0.0128 [ 0.9099] | 1.0219 [ 0.3122] | 0.126 [ 0.7226] |
| Hetersoskedasticity Glejser | 0.419 [0.1514] | 14.14 [ 0.2253] | 10.513 [ 0.1047] | 21.54 [ 0.0430] |
| Hetersoskedasticity White | 3.359 [0.7526] | 9.665 [ 0.5607] | 9.292 [ 0.1578] | 14.878 [ 0.1881] |
| Total WTP | 36.99 | 37.6 | 50.5 | 60.12 |
P-values in brackets
7.4 Conclusions
Our findings show that the significance of intangible cultural heritage varies between European and non-European countries. More specifically, in the case of European countries, intangible cultural heritage is influenced by aesthetic and spiritual values, while in non-European countries, it is affected by symbolic and social values. In terms of income level, it is revealed that it does not significantly affect the willingness to pay in European countries, but this is not the case in non-European countries. And one more differentiation is that, in non-European countries, higher levels of education and younger age are associated with a greater willingness to pay for intangible cultural heritage.
Overall, the study shows that the economic value of intangible cultural heritage varies depending on multiple factors including geographic location, cultural values, income levels, age. Therefore, policymakers should consider the differing cultural values and economic implications of intangible cultural heritage when developing conservation policies. Moreover, they should also focus on promoting and capitalizing the economic value of cultural heritage through accurate measurement and valuation techniques. Furthermore, policymakers should pay attention to the demographic factors that influence willingness to pay for intangible cultural heritage, such as age and education levels. In conclusion, the economic value of cultural heritage is complex and depends on a variety of factors. Therefore, a holistic approach is necessary to assess and promote the economic value of intangible cultural heritage.
7.5 Chapter references
Adger, W. N. (2010). Social capital, collective action, and adaptation to climate change. Der Klimawandel: Sozialwissenschaftliche Perspektiven, 327-345
Chetty, R., Jackson, M.O., Kuchler, T. et al. Social capital I: measurement and associations with economic mobility. Nature 608, 108–121 (2022). https://doi.org/10.1038/s41586-022-04996-4
Dasgupta, P. (2021). The economics of biodiversity: the Dasgupta review. Hm Treasury
Halkos G. (2021). Economics of Natural Resources and the Environment. 2nd Edition, DISIGMA Publ.
Lenzerini F., Intangible Cultural Heritage: The Living Culture of Peoples, European Journal of International Law, Volume 22, Issue 1, February 2011, Pages 101–120, https://doi.org/10.1093/ejil/chr006
Nijkamp, P. (2012). Economic valuation of cultural heritage. The economics of uniqueness: Investing in historic city cores and cultural heritage assets for sustainable development, 75, 75-103.
Panzera, E. (2022). From Cultural Heritage to Economic Development Through Tourism. In: Cultural Heritage and Territorial Identity. Advances in Spatial Science. Springer, Cham. https://doi.org/10.1007/978-3-030-94468-1_3
Riganti, P., & Throsby, D. (2021). Editors’ introduction: Recent developments in urban heritage valuation: Concepts, methods and policy application. City, Culture and Society, 26, 100414.
Setyari, N. P. W., Purwanti, P. A. P., Saskara, I. A. N., & Bendesa, I. K. G. (2022). The effect of social capital on individual happiness in Indonesia. Simulacra, 5(1), 45-56
Throsby, D. (1999). Cultural capital. Journal of cultural economics, 23, 3-12.
Trim, I. (2022, August 31). A tale of three capitals: preserving natural capital. The Actuary. https://www.theactuary.com/features/2022/08/30/tale-three-capitals-preserving-natural-capital
UNESCO Institute for Statistics, 2009 UNESCO Framework for Cultural Statistics. Retrieved May 29, 2023, from http://uis.unesco.org/en/glossary-term/cultural-heritage
UNESCO. (2017, April 11). Culture: at the heart of SDGs. UNESCO. https://en.unesco.org/courier/april-june-2017/culture-heart-sdgs
Völker, B. Disaster recovery via social capital. Nat Sustain 5, 96–97 (2022). <https://doi.org/10.1038/s41893-021-00820-5
Footnotes
For the full list of studies please refer to Appendix B ↩︎